Seagate 2010 Annual Report Download - page 70
Download and view the complete annual report
Please find page 70 of the 2010 Seagate annual report below. You can navigate through the pages in the report by either clicking on the pages listed below, or by using the keyword search tool below to find specific information within the annual report.-
 1
1 -
2
-
3
-
4
-
5
-
6
-
7
-
8
-
9
-
10
-
11
-
12
-
13
-
14
-
15
-
16
-
17
-
18
-
19
-
20
-
21
-
22
-
23
-
24
-
25
-
26
-
27
-
28
-
29
-
30
-
31
-
32
-
33
-
34
-
35
-
36
-
37
-
38
-
39
-
40
-
41
-
42
-
43
-
44
-
45
-
46
-
47
-
48
-
49
-
50
-
51
-
52
-
53
-
54
-
55
-
56
-
57
-
58
-
59
-
 60
60 -
 61
61 -
 62
62 -
 63
63 -
 64
64 -
 65
65 -
 66
66 -
 67
67 -
 68
68 -
 69
69 -
 70
70 -
 71
71 -
 72
72 -
 73
73 -
 74
74 -
 75
75 -
 76
76 -
 77
77 -
 78
78 -
 79
79 -
 80
80 -
81
-
82
-
83
-
84
-
85
-
86
-
87
-
88
-
89
-
90
-
91
-
92
-
93
-
94
-
95
-
96
-
97
-
98
-
99
-
100
-
101
-
102
-
103
-
104
-
105
-
106
-
107
-
108
-
109
-
110
-
111
-
112
-
113
-
114
-
115
-
116
-
117
-
118
-
119
-
120
-
121
-
122
-
123
-
124
-
125
-
126
-
127
-
128
-
129
-
130
-
131
-
132
-
133
-
134
-
135
-
136
-
137
-
138
-
139
-
140
-
141
-
142
-
143
-
144
-
145
-
146
-
147
-
148
-
149
-
150
-
151
-
152
-
153
-
154
-
155
-
156
-
157
-
158
-
159
-
160
-
161
-
162
-
163
-
164
-
165
-
166
-
167
-
168
-
169
-
170
-
171
-
172
-
173
-
174
-
175
-
176
-
177
-
178
-
179
-
180
-
181
-
182
-
183
-
184
-
185
-
186
-
187
-
188
-
189
-
190
-
191
-
192
-
193
-
194
-
195
-
196
-
197
-
198
-
199
-
200
-
201
-
202
-
203
-
204
-
205
-
206
-
207
-
208
-
209
-
210
-
211
-
212
-
213
-
214
-
215
-
216
-
217
-
218
-
219
-
220
-
221
-
222
-
223
-
224
-
225
-
226
-
227
-
228
-
229
-
230
-
231
-
232
-
233
-
234
-
235
-
236
-
237
-
238
-
239
-
240
-
241
-
242
-
243
-
244
-
245
-
246
-
247
-
248
-
249
-
250
-
251
-
252
-
253
-
254
-
255
-
256
-
257
-
258
-
259
-
260
-
261
-
262
-
263
-
264
-
265
-
266
-
267
-
268
-
269
-
270
-
271
-
272
-
273
-
274
-
275
-
276
-
277
-
278
-
279
-
280
-
281
-
282
-
283
-
284
-
285
 |
 |

Table of Contents
Recent Accounting Pronouncements
See Item 8. Financial Statements and Supplementary Data, Note 1. Basis of Presentation and Summary of Significant Accounting Policies
for information regarding the effect of new accounting pronouncements on our financial statements.
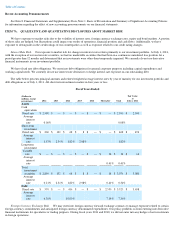
ITEM 7A. QUALITATIVE AND QUANTITATIVE DISCLOSURES ABOUT MARKET RISK
We have exposure to market risks due to the volatility of interest rates, foreign currency exchange rates, equity and bond markets. A portion
of these risks are hedged, but fluctuations could impact our results of operations, financial position and cash flows. Additionally, we have
exposure to downgrades in the credit ratings of our counterparties as well as exposure related to our credit rating changes.
Interest Rate Risk. Our exposure to market risk for changes in interest rates relates primarily to our investment portfolio. At July 1, 2011,
with the exception of our auction rate securities, we had no marketable securities that had been in a continuous unrealized loss position for a
period greater than 12 months and determined that no investments were other-than-temporarily impaired. We currently do not use derivative
financial instruments in our investment portfolio.
We have fixed rate debt obligations. We enter into debt obligations for general corporate purposes including capital expenditures and
working capital needs. We currently do not use interest rate derivatives to hedge interest rate exposure on our outstanding debt.
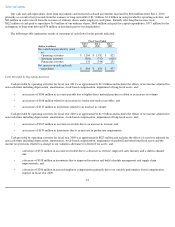
The table below presents principal amounts and related weighted average interest rates by year of maturity for our investment portfolio and
debt obligations as of July 1, 2011. All short-term investments mature in four years or less.
Fiscal Years Ended
Foreign Currency Exchange Risk. We may enter into foreign currency forward exchange contracts to manage exposure related to certain
foreign currency commitments and anticipated foreign currency denominated expenditures. Our policy prohibits us from entering into derivative
financial instruments for speculative or trading purposes. During fiscal years 2011 and 2010, we did not enter into any hedges of net investments
in foreign operations.
(Dollars in
millions, except
percentages)
2012
2013
2014
2015
2016
Thereafter
Total
Fair Value
at
July 1, 2011
Assets
Cash
equivalents:
Fixed rate
$
2,590
$
—
$
—
$
—
$
—
$
—
$
2,590
$
2,590
Average
interest
rate
0.08
%
0.08
%
Short-term
investments:
Fixed rate
$
260
$
132
$
68
$
8
$
—
$
—
$
468
$
474
Average
interest
rate
1.53
%
2.34
%
1.82
%
2.98
%
1.82
%
Long-term
investments:
Variable
rate
$
—
$
—
$
—
$
—
$
—
$
18
$
18
$
16
Average
interest
rate
0.41
%
0.41
%
Total
investment
securities
$
2,850
$
132
$
68
$
8
$
—
$
18
$
3,076
$
3,080
Average
interest
rate
0.21
%
2.34
%
1.82
%
2.98
%
0.41
%
0.34
%
Debt
Fixed rate
$
559
$
—
$
416
$
—
$
—
$
2,550
$
3,525
$
3,658
Average
interest
rate
6.38
%
10.00
%
7.14
%
7.36
%