Seagate 2010 Annual Report Download - page 111
Download and view the complete annual report
Please find page 111 of the 2010 Seagate annual report below. You can navigate through the pages in the report by either clicking on the pages listed below, or by using the keyword search tool below to find specific information within the annual report.-
 1
1 -
2
-
3
-
4
-
5
-
6
-
7
-
8
-
9
-
10
-
11
-
12
-
13
-
14
-
15
-
16
-
17
-
18
-
19
-
20
-
21
-
22
-
23
-
24
-
25
-
26
-
27
-
28
-
29
-
30
-
31
-
32
-
33
-
34
-
35
-
36
-
37
-
38
-
39
-
40
-
41
-
42
-
43
-
44
-
45
-
46
-
47
-
48
-
49
-
50
-
51
-
52
-
53
-
54
-
55
-
56
-
57
-
58
-
59
-
60
-
61
-
62
-
63
-
64
-
65
-
66
-
67
-
68
-
69
-
70
-
71
-
72
-
73
-
74
-
75
-
76
-
77
-
78
-
79
-
80
-
81
-
82
-
83
-
84
-
85
-
86
-
87
-
88
-
89
-
90
-
91
-
92
-
93
-
94
-
95
-
96
-
97
-
98
-
99
-
100
-
 101
101 -
 102
102 -
 103
103 -
 104
104 -
 105
105 -
 106
106 -
 107
107 -
 108
108 -
 109
109 -
 110
110 -
 111
111 -
 112
112 -
 113
113 -
 114
114 -
 115
115 -
 116
116 -
 117
117 -
 118
118 -
 119
119 -
 120
120 -
 121
121 -
122
-
123
-
124
-
125
-
126
-
127
-
128
-
129
-
130
-
131
-
132
-
133
-
134
-
135
-
136
-
137
-
138
-
139
-
140
-
141
-
142
-
143
-
144
-
145
-
146
-
147
-
148
-
149
-
150
-
151
-
152
-
153
-
154
-
155
-
156
-
157
-
158
-
159
-
160
-
161
-
162
-
163
-
164
-
165
-
166
-
167
-
168
-
169
-
170
-
171
-
172
-
173
-
174
-
175
-
176
-
177
-
178
-
179
-
180
-
181
-
182
-
183
-
184
-
185
-
186
-
187
-
188
-
189
-
190
-
191
-
192
-
193
-
194
-
195
-
196
-
197
-
198
-
199
-
200
-
201
-
202
-
203
-
204
-
205
-
206
-
207
-
208
-
209
-
210
-
211
-
212
-
213
-
214
-
215
-
216
-
217
-
218
-
219
-
220
-
221
-
222
-
223
-
224
-
225
-
226
-
227
-
228
-
229
-
230
-
231
-
232
-
233
-
234
-
235
-
236
-
237
-
238
-
239
-
240
-
241
-
242
-
243
-
244
-
245
-
246
-
247
-
248
-
249
-
250
-
251
-
252
-
253
-
254
-
255
-
256
-
257
-
258
-
259
-
260
-
261
-
262
-
263
-
264
-
265
-
266
-
267
-
268
-
269
-
270
-
271
-
272
-
273
-
274
-
275
-
276
-
277
-
278
-
279
-
280
-
281
-
282
-
283
-
284
-
285
 |
 |

Table of Contents
SEAGATE TECHNOLOGY PLC
NOTES TO CONSOLIDATED FINANCIAL STATEMENTS—(Continued)
Expected Volatility —The Company uses a combination of the implied volatility of its traded options and historical volatility of its share
price.
Expected Dividend —The Black-Scholes-Merton valuation model calls for a single expected dividend yield as an input. The dividend yield
is determined by dividing the expected per share dividend during the coming year by the grant date share price. The expected dividend
assumption is based on the Company's current expectations about its anticipated dividend policy. Also, because the expected dividend yield
should reflect marketplace participants' expectations, the Company does not incorporate changes in dividends anticipated by management unless
those changes have been communicated to or otherwise are anticipated by marketplace participants.
Risk-Free Interest Rate —The Company bases the risk-free interest rate used in the Black-Scholes-Merton valuation model on the implied
yield currently available on U.S. Treasury zero
-coupon issues with an equivalent remaining term. Where the expected term of the Company's
stock-based awards do not correspond with the terms for which interest rates are quoted, the Company performed a straight-line interpolation to
determine the rate from the available term maturities.
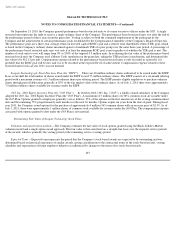
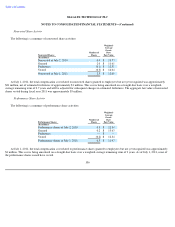
Fair Value —
The fair value of the Company's nonvested shares and performance shares for fiscal years 2011, 2010, and 2009 is the price of
the Company's shares on the grant date.
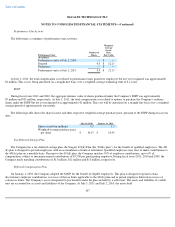
The fair value of the Company's shares related to options granted to employees and shares issued from the ESPP for fiscal years 2011, 2010
and 2009 were estimated using the following weighted-average assumptions:
104
Fiscal Years
2011
2010
2009
Nonvested shares
Weighted
-
average fair value
$
11.61
$
15.47
$
13.09
Performance shares
Weighted
-
average fair value
$
13.63
n/a
$
12.38
Performance units
Weighted
-
average fair value
$
12.13
n/a
n/a
Fiscal Years
2011
2010
2009
Options
Expected term (in years)
4.2
4.2
4.0
–
4.5
Volatility
49
–
57%
51
–
57%
36
–
50%
Expected dividend rate
0
–
4.3%
0%
0
–
12.2%
Risk
-
free interest rate
0.9
–
1.8%
1.7
–
2.1%
1.6
–
3.0%
Weighted
-
average fair
value
$5.32
$6.45
$1.47
ESPP
Expected term (in years)
0.5
0.5
0.5
Volatility
44
–
47%
49
–
60%
39
–
84%
Expected dividend rate
0%
0%
3.0
–
3.2%
Risk
-
free interest rate
0.1
–
0.2%
0.2
–
0.3%
0.4
–
2.0%
Weighted-average fair
value
$3.42
$4.19
$2.48