Seagate 2010 Annual Report Download - page 62
Download and view the complete annual report
Please find page 62 of the 2010 Seagate annual report below. You can navigate through the pages in the report by either clicking on the pages listed below, or by using the keyword search tool below to find specific information within the annual report.-
 1
1 -
2
-
3
-
4
-
5
-
6
-
7
-
8
-
9
-
10
-
11
-
12
-
13
-
14
-
15
-
16
-
17
-
18
-
19
-
20
-
21
-
22
-
23
-
24
-
25
-
26
-
27
-
28
-
29
-
30
-
31
-
32
-
33
-
34
-
35
-
36
-
37
-
38
-
39
-
40
-
41
-
42
-
43
-
44
-
45
-
46
-
47
-
48
-
49
-
50
-
51
-
 52
52 -
 53
53 -
 54
54 -
 55
55 -
 56
56 -
 57
57 -
 58
58 -
 59
59 -
 60
60 -
 61
61 -
 62
62 -
 63
63 -
 64
64 -
 65
65 -
 66
66 -
 67
67 -
 68
68 -
 69
69 -
 70
70 -
 71
71 -
 72
72 -
73
-
74
-
75
-
76
-
77
-
78
-
79
-
80
-
81
-
82
-
83
-
84
-
85
-
86
-
87
-
88
-
89
-
90
-
91
-
92
-
93
-
94
-
95
-
96
-
97
-
98
-
99
-
100
-
101
-
102
-
103
-
104
-
105
-
106
-
107
-
108
-
109
-
110
-
111
-
112
-
113
-
114
-
115
-
116
-
117
-
118
-
119
-
120
-
121
-
122
-
123
-
124
-
125
-
126
-
127
-
128
-
129
-
130
-
131
-
132
-
133
-
134
-
135
-
136
-
137
-
138
-
139
-
140
-
141
-
142
-
143
-
144
-
145
-
146
-
147
-
148
-
149
-
150
-
151
-
152
-
153
-
154
-
155
-
156
-
157
-
158
-
159
-
160
-
161
-
162
-
163
-
164
-
165
-
166
-
167
-
168
-
169
-
170
-
171
-
172
-
173
-
174
-
175
-
176
-
177
-
178
-
179
-
180
-
181
-
182
-
183
-
184
-
185
-
186
-
187
-
188
-
189
-
190
-
191
-
192
-
193
-
194
-
195
-
196
-
197
-
198
-
199
-
200
-
201
-
202
-
203
-
204
-
205
-
206
-
207
-
208
-
209
-
210
-
211
-
212
-
213
-
214
-
215
-
216
-
217
-
218
-
219
-
220
-
221
-
222
-
223
-
224
-
225
-
226
-
227
-
228
-
229
-
230
-
231
-
232
-
233
-
234
-
235
-
236
-
237
-
238
-
239
-
240
-
241
-
242
-
243
-
244
-
245
-
246
-
247
-
248
-
249
-
250
-
251
-
252
-
253
-
254
-
255
-
256
-
257
-
258
-
259
-
260
-
261
-
262
-
263
-
264
-
265
-
266
-
267
-
268
-
269
-
270
-
271
-
272
-
273
-
274
-
275
-
276
-
277
-
278
-
279
-
280
-
281
-
282
-
283
-
284
-
285
 |
 |

Table of Contents
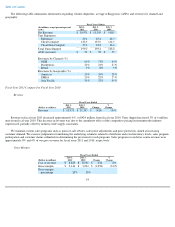
and additional restructuring charges related to our Pittsburgh, Pennsylvania facility and facilities acquired as a part of the Maxtor acquisition.
Restructuring and Other, net decreased approximately $144 million in fiscal year 2010 when compared to the fiscal year 2009, which
include restructuring plans announced in January and May 2009 that were intended to realign our cost structure with the fiscal year 2009
macroeconomic business environment.
Impairment of Goodwill and Other Long-Lived Assets, net of Recoveries. During fiscal year 2010, we committed to a plan to sell certain
equipment related to certain research activities that had ceased. In connection with this plan, we reclassified these assets as held for sale and
recorded a net impairment charge of approximately $57 million to adjust the carrying value of these assets to the estimated fair value, less cost to
sell.
Impairment of goodwill and other long-lived assets, net of recoveries decreased approximately $2.2 billion in fiscal year 2010 when
compared to the fiscal year 2009 due to non-recurring $2.3 billion impairment charge we recorded in fiscal year 2009 as a result of the
significant adverse change to our business climate.
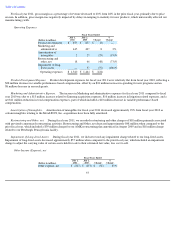
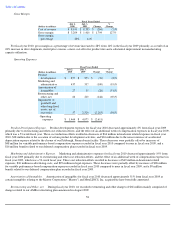
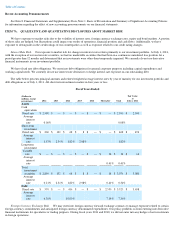
Other Income (Expense), net
The change in Other income (expense), net for fiscal year 2010 compared to fiscal year 2009 was primarily due to a $31 million increase in
interest expense resulting from higher average borrowing costs, a decrease in gains from foreign currency remeasurements of $15 million, a
$13 million write-down of an equity investment in fiscal year 2010, a $12 million decrease in interest income as a result of lower yields on our
cash and investments and an $8 million non-recurring gain recognized on the sale of an equity investment in fiscal year 2009. These were
partially offset by a $44 million loss related to our deferred compensation plan assets recorded in fiscal year 2009.
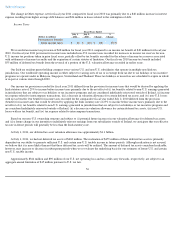
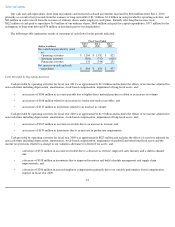
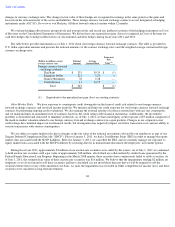
Income Taxes
During fiscal year ended July 2, 2010, an enacted legislative change in U.S. tax law was taken into account in computing our income tax
provision. The Worker, Homeownership, and Business Assistance Act of 2009, was enacted on November 6, 2009. This law allowed us to elect
an increased carryback period for net operating losses incurred in 2008 or 2009 from two years to three, four or five years at our option. We
recorded an $11 million income tax benefit as a result of the increased carryback period.
We recorded an income tax benefit of $40 million for fiscal year 2010 compared to a provision for income taxes of $311 million for fiscal
year 2009. Our fiscal year 2009 provision for income taxes included $271 million of income tax expense recorded in the second quarter
associated with an increase in our valuation allowance for U.S. deferred tax assets related to a reduction in our forecasted U.S. taxable income.
In connection with our previously announced plans to move our corporate headquarters to Ireland, we initiated certain pre-reorganization
steps which resulted in our existing Cayman parent holding company
59
Fiscal Years Ended
(Dollars in millions)
July 2,
2010 July 3,
2009 Change %
Change
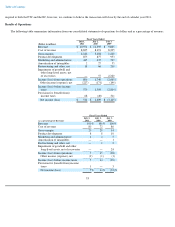
Other income (expense),
net
$
(171
)
$
(149
)
$
(22
)
15
%
Fiscal Years Ended
(Dollars in millions)
July 2,
2010
July 3,
2009
Change
%
Change
Provision for (benefit
from) income taxes
$
(40
)
$
311
$
(351
)
(113
)%