Seagate 2010 Annual Report Download - page 56
Download and view the complete annual report
Please find page 56 of the 2010 Seagate annual report below. You can navigate through the pages in the report by either clicking on the pages listed below, or by using the keyword search tool below to find specific information within the annual report.-
 1
1 -
2
-
3
-
4
-
5
-
6
-
7
-
8
-
9
-
10
-
11
-
12
-
13
-
14
-
15
-
16
-
17
-
18
-
19
-
20
-
21
-
22
-
23
-
24
-
25
-
26
-
27
-
28
-
29
-
30
-
31
-
32
-
33
-
34
-
35
-
36
-
37
-
38
-
39
-
40
-
41
-
42
-
43
-
44
-
45
-
 46
46 -
 47
47 -
 48
48 -
 49
49 -
 50
50 -
 51
51 -
 52
52 -
 53
53 -
 54
54 -
 55
55 -
 56
56 -
 57
57 -
 58
58 -
 59
59 -
 60
60 -
 61
61 -
 62
62 -
 63
63 -
 64
64 -
 65
65 -
 66
66 -
67
-
68
-
69
-
70
-
71
-
72
-
73
-
74
-
75
-
76
-
77
-
78
-
79
-
80
-
81
-
82
-
83
-
84
-
85
-
86
-
87
-
88
-
89
-
90
-
91
-
92
-
93
-
94
-
95
-
96
-
97
-
98
-
99
-
100
-
101
-
102
-
103
-
104
-
105
-
106
-
107
-
108
-
109
-
110
-
111
-
112
-
113
-
114
-
115
-
116
-
117
-
118
-
119
-
120
-
121
-
122
-
123
-
124
-
125
-
126
-
127
-
128
-
129
-
130
-
131
-
132
-
133
-
134
-
135
-
136
-
137
-
138
-
139
-
140
-
141
-
142
-
143
-
144
-
145
-
146
-
147
-
148
-
149
-
150
-
151
-
152
-
153
-
154
-
155
-
156
-
157
-
158
-
159
-
160
-
161
-
162
-
163
-
164
-
165
-
166
-
167
-
168
-
169
-
170
-
171
-
172
-
173
-
174
-
175
-
176
-
177
-
178
-
179
-
180
-
181
-
182
-
183
-
184
-
185
-
186
-
187
-
188
-
189
-
190
-
191
-
192
-
193
-
194
-
195
-
196
-
197
-
198
-
199
-
200
-
201
-
202
-
203
-
204
-
205
-
206
-
207
-
208
-
209
-
210
-
211
-
212
-
213
-
214
-
215
-
216
-
217
-
218
-
219
-
220
-
221
-
222
-
223
-
224
-
225
-
226
-
227
-
228
-
229
-
230
-
231
-
232
-
233
-
234
-
235
-
236
-
237
-
238
-
239
-
240
-
241
-
242
-
243
-
244
-
245
-
246
-
247
-
248
-
249
-
250
-
251
-
252
-
253
-
254
-
255
-
256
-
257
-
258
-
259
-
260
-
261
-
262
-
263
-
264
-
265
-
266
-
267
-
268
-
269
-
270
-
271
-
272
-
273
-
274
-
275
-
276
-
277
-
278
-
279
-
280
-
281
-
282
-
283
-
284
-
285
 |
 |

Table of Contents
respond to both the FTC and the EC, however, we continue to believe the transaction will close by the end of calendar year 2011.
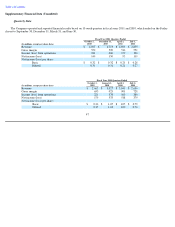
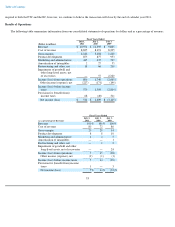
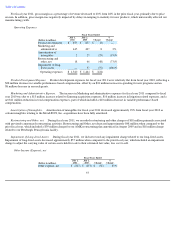
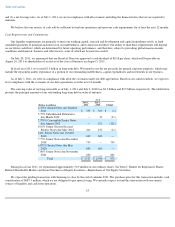
Results of Operations
The following table summarizes information from our consolidated statements of operations by dollars and as a percentage of revenue:
53
Fiscal Years Ended
(Dollars in millions)
July 1,
2011
July 2,
2010
July 3,
2009
Revenue
$
10,971
$
11,395
$
9,805
Cost of revenue
8,825
8,191
8,395
Gross margin
2,146
3,204
1,410
Product development
875
877
953
Marketing and administrative
445
437
537
Amortization of intangibles
2
27
55
Restructuring and other, net
18
66
210
Impairment of goodwill and
other long-lived assets, net
of recoveries
—
57
2,320
Income (loss) from operations
806
1,740
(2,665
)
Other income (expense), net
(227
)
(171
)
(149
)
Income (loss) before income
taxes
579
1,569
(2,814
)
Provision for (benefit from)
income taxes
68
(40
)
311
Net income (loss)
$
511
$
1,609
$
(3,125
)
Fiscal Years Ended
(as a percentage of Revenue)
July 1,
2011
July 2,
2010
July 3,
2009
Revenue
100
%
100
%
100
%
Cost of revenue
80
72
86
Gross margin
20
28
14
Product development
8
8
10
Marketing and administrative
4
4
5
Amortization of intangibles
—
—
1
Restructuring and other, net
—
1
2
Impairment of goodwill and other
long
-
lived assets, net of recoveries
—
—
24
Income (loss) from operations
7
15
(28
)
Other income (expense), net
(2
)
(1
)
(1
)
Income (loss) before income taxes
5
14
(29
)
Provision for (benefit from) income
taxes
1
—
3
Net income (loss)
5
%
14
%
(32
)%