Seagate 2010 Annual Report Download - page 61
Download and view the complete annual report
Please find page 61 of the 2010 Seagate annual report below. You can navigate through the pages in the report by either clicking on the pages listed below, or by using the keyword search tool below to find specific information within the annual report.-
 1
1 -
 2
2 -
 3
3 -
 4
4 -
 5
5 -
 6
6 -
 7
7 -
 8
8 -
 9
9 -
 10
10 -
 11
11 -
 12
12 -
 13
13 -
 14
14 -
 15
15 -
 16
16 -
 17
17 -
 18
18 -
 19
19 -
 20
20 -
 21
21 -
 22
22 -
 23
23 -
 24
24 -
 25
25 -
 26
26 -
 27
27 -
 28
28 -
 29
29 -
 30
30 -
 31
31 -
 32
32 -
 33
33 -
 34
34 -
 35
35 -
 36
36 -
 37
37 -
 38
38 -
 39
39 -
 40
40 -
 41
41 -
 42
42 -
 43
43 -
 44
44 -
 45
45 -
 46
46 -
 47
47 -
 48
48 -
 49
49 -
 50
50 -
 51
51 -
 52
52 -
 53
53 -
 54
54 -
 55
55 -
 56
56 -
 57
57 -
 58
58 -
 59
59 -
 60
60 -
 61
61 -
 62
62 -
 63
63 -
 64
64 -
 65
65 -
 66
66 -
 67
67 -
 68
68 -
 69
69 -
 70
70 -
 71
71 -
 72
72 -
 73
73 -
 74
74 -
 75
75 -
 76
76 -
 77
77 -
 78
78 -
 79
79 -
 80
80 -
 81
81 -
 82
82 -
 83
83 -
 84
84 -
 85
85 -
 86
86 -
 87
87 -
 88
88 -
 89
89 -
 90
90 -
 91
91 -
 92
92 -
 93
93 -
 94
94 -
 95
95 -
 96
96 -
 97
97 -
 98
98 -
 99
99 -
 100
100 -
 101
101 -
 102
102 -
 103
103 -
 104
104 -
 105
105 -
 106
106 -
 107
107 -
 108
108 -
 109
109 -
 110
110 -
 111
111 -
 112
112 -
 113
113 -
 114
114 -
 115
115 -
 116
116 -
 117
117 -
 118
118 -
 119
119 -
 120
120 -
 121
121 -
 122
122 -
 123
123 -
 124
124 -
 125
125 -
 126
126 -
 127
127 -
 128
128 -
 129
129 -
 130
130 -
 131
131 -
 132
132 -
 133
133 -
 134
134 -
 135
135 -
 136
136 -
 137
137 -
 138
138 -
 139
139 -
 140
140 -
 141
141 -
 142
142 -
 143
143 -
 144
144 -
 145
145 -
 146
146 -
 147
147 -
 148
148 -
 149
149 -
 150
150 -
 151
151 -
 152
152 -
 153
153 -
 154
154 -
 155
155 -
 156
156 -
 157
157 -
 158
158 -
 159
159 -
 160
160 -
 161
161 -
 162
162 -
 163
163 -
 164
164 -
 165
165 -
 166
166 -
 167
167 -
 168
168 -
 169
169 -
 170
170 -
 171
171 -
 172
172 -
 173
173 -
 174
174 -
 175
175 -
 176
176 -
 177
177 -
 178
178 -
 179
179 -
 180
180 -
 181
181 -
 182
182 -
 183
183 -
 184
184 -
 185
185 -
 186
186 -
 187
187 -
 188
188 -
 189
189 -
 190
190 -
 191
191 -
 192
192 -
 193
193 -
 194
194 -
 195
195 -
 196
196 -
 197
197 -
 198
198 -
 199
199 -
 200
200 -
 201
201 -
 202
202 -
 203
203 -
 204
204 -
 205
205 -
 206
206 -
 207
207 -
 208
208 -
 209
209 -
 210
210 -
 211
211 -
 212
212 -
 213
213 -
 214
214 -
 215
215 -
 216
216 -
 217
217 -
 218
218 -
 219
219 -
 220
220 -
 221
221 -
 222
222 -
 223
223 -
 224
224 -
 225
225 -
 226
226 -
 227
227 -
 228
228 -
 229
229 -
 230
230 -
 231
231 -
 232
232 -
 233
233 -
 234
234 -
 235
235 -
 236
236 -
 237
237 -
 238
238 -
 239
239 -
 240
240 -
 241
241 -
 242
242 -
 243
243 -
 244
244 -
 245
245 -
 246
246 -
 247
247 -
 248
248 -
 249
249 -
 250
250 -
 251
251 -
 252
252 -
 253
253 -
 254
254 -
 255
255 -
 256
256 -
 257
257 -
 258
258 -
 259
259 -
 260
260 -
 261
261 -
 262
262 -
 263
263 -
 264
264 -
 265
265 -
 266
266 -
 267
267 -
 268
268 -
 269
269 -
 270
270 -
 271
271 -
 272
272 -
 273
273 -
 274
274 -
 275
275 -
 276
276 -
 277
277 -
 278
278 -
 279
279 -
 280
280 -
 281
281 -
 282
282 -
 283
283 -
 284
284 -
 285
285
 |
 |

Table of Contents
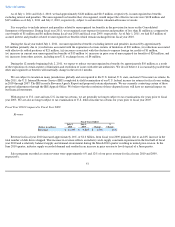
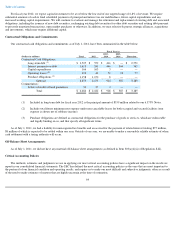
Gross Margin
For fiscal year 2010, gross margin as a percentage of revenue increased to 28% from 14% in the fiscal year 2009 primarily as a result of an
18% increase in drive shipments, muted price erosion, a more cost-effective product mix and a substantial improvement in manufacturing
capacity utilization.
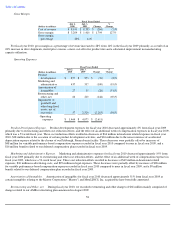
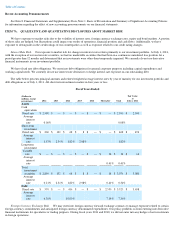
Operating Expenses
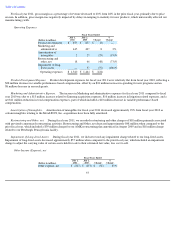
Product Development Expense. Product development expenses for fiscal year 2010 decreased approximately 8% from fiscal year 2009
primarily due to restructuring and other cost reduction efforts, and the effect of an additional week of compensation expenses in fiscal year 2009,
which was a 53-week fiscal year. These cost reduction efforts resulted in decreases of $66 million in headcount related expenses in fiscal year
2010, $38 million due to the cessation of certain product development activities, and $26 million due to the non-recurrence of accelerated
depreciation expense related to the closure of our Pittsburgh, Pennsylvania facility. These decreases were partially offset by increases of
$48 million for variable performance-based compensation expense recorded in fiscal year 2010 compared to none in fiscal year 2009, and a
$16 million benefit related to our deferred compensation plan recorded in fiscal year 2009.
Marketing and Administrative Expense. Marketing and administrative expenses for fiscal year 2010 decreased approximately 19% from
fiscal year 2009 primarily due to restructuring and other cost reduction efforts, and the effect of an additional week of compensation expenses in
fiscal year 2009, which was a 53-week fiscal year. These cost reduction efforts resulted in decreases of $69 million in headcount related
expenses, $26 million in advertising costs, and $29 million in legal expenses. These decreases were partially offset by increases of $28 million
for variable performance-based compensation expense recorded in fiscal year 2010 compared to none in fiscal year 2009, and a $9 million
benefit related to our deferred compensation plan recorded in fiscal year 2009.
Amortization of Intangibles. Amortization of intangibles for fiscal year 2010 decreased approximately 51% from fiscal year 2009 as
certain intangibles relating to the Maxtor Corporation ("Maxtor") and MetaLINCS, Inc. acquisitions have been fully amortized.
Restructuring and Other, net. During fiscal year 2010, we recorded restructuring and other charges of $66 million mainly comprised of
charges related to our AMK restructuring plan announced in August 2009
58
Fiscal Years Ended
(Dollars in millions)
July 2,
2010
July 3,
2009
Change
%
Change
Cost of revenue
$
8,191
$
8,395
$
(204
)
(2
)%
Gross margin
$
3,204
$
1,410
$
1,794
127
%
Gross margin
percentage
28
%
14
%
Fiscal Years Ended
(Dollars in millions)
July 2,
2010
July 3,
2009
Change
%
Change
Product
development
$
877
$
953
$
(76
)
(8
)%
Marketing and
administrative
437
537
(100
)
(19
)%
Amortization of
intangibles
27
55
(28
)
(51
)%
Restructuring and
other, net
66
210
(144
)
(69
)%
Impairment of
goodwill and
other long-lived
assets, net of
recoveries
57
2,320
(2,263
)
(98
)%
Operating
expenses
$
1,464
$
4,075
$
(2,611
)
