Seagate 2010 Annual Report Download - page 59
Download and view the complete annual report
Please find page 59 of the 2010 Seagate annual report below. You can navigate through the pages in the report by either clicking on the pages listed below, or by using the keyword search tool below to find specific information within the annual report.-
 1
1 -
2
-
3
-
4
-
5
-
6
-
7
-
8
-
9
-
10
-
11
-
12
-
13
-
14
-
15
-
16
-
17
-
18
-
19
-
20
-
21
-
22
-
23
-
24
-
25
-
26
-
27
-
28
-
29
-
30
-
31
-
32
-
33
-
34
-
35
-
36
-
37
-
38
-
39
-
40
-
41
-
42
-
43
-
44
-
45
-
46
-
47
-
48
-
 49
49 -
 50
50 -
 51
51 -
 52
52 -
 53
53 -
 54
54 -
 55
55 -
 56
56 -
 57
57 -
 58
58 -
 59
59 -
 60
60 -
 61
61 -
 62
62 -
 63
63 -
 64
64 -
 65
65 -
 66
66 -
 67
67 -
 68
68 -
 69
69 -
70
-
71
-
72
-
73
-
74
-
75
-
76
-
77
-
78
-
79
-
80
-
81
-
82
-
83
-
84
-
85
-
86
-
87
-
88
-
89
-
90
-
91
-
92
-
93
-
94
-
95
-
96
-
97
-
98
-
99
-
100
-
101
-
102
-
103
-
104
-
105
-
106
-
107
-
108
-
109
-
110
-
111
-
112
-
113
-
114
-
115
-
116
-
117
-
118
-
119
-
120
-
121
-
122
-
123
-
124
-
125
-
126
-
127
-
128
-
129
-
130
-
131
-
132
-
133
-
134
-
135
-
136
-
137
-
138
-
139
-
140
-
141
-
142
-
143
-
144
-
145
-
146
-
147
-
148
-
149
-
150
-
151
-
152
-
153
-
154
-
155
-
156
-
157
-
158
-
159
-
160
-
161
-
162
-
163
-
164
-
165
-
166
-
167
-
168
-
169
-
170
-
171
-
172
-
173
-
174
-
175
-
176
-
177
-
178
-
179
-
180
-
181
-
182
-
183
-
184
-
185
-
186
-
187
-
188
-
189
-
190
-
191
-
192
-
193
-
194
-
195
-
196
-
197
-
198
-
199
-
200
-
201
-
202
-
203
-
204
-
205
-
206
-
207
-
208
-
209
-
210
-
211
-
212
-
213
-
214
-
215
-
216
-
217
-
218
-
219
-
220
-
221
-
222
-
223
-
224
-
225
-
226
-
227
-
228
-
229
-
230
-
231
-
232
-
233
-
234
-
235
-
236
-
237
-
238
-
239
-
240
-
241
-
242
-
243
-
244
-
245
-
246
-
247
-
248
-
249
-
250
-
251
-
252
-
253
-
254
-
255
-
256
-
257
-
258
-
259
-
260
-
261
-
262
-
263
-
264
-
265
-
266
-
267
-
268
-
269
-
270
-
271
-
272
-
273
-
274
-
275
-
276
-
277
-
278
-
279
-
280
-
281
-
282
-
283
-
284
-
285
 |
 |

Table of Contents
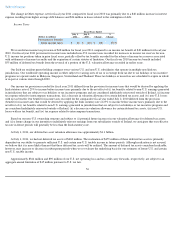
The change in Other expense, net for fiscal year 2011 compared to fiscal year 2010 was primarily due to a $40 million increase in interest
expense resulting from higher average debt balances and $24 million in losses related to the redemption of debt.
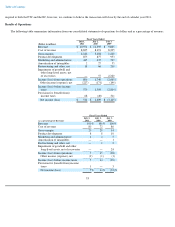
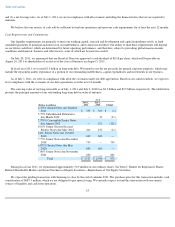
Income Taxes
We recorded an income tax provision of $68 million for fiscal year 2011 compared to an income tax benefit of $40 million for fiscal year
2010. Our fiscal year 2011 provision for income taxes included non-U.S. income taxes recorded for increases in income tax reserves for non-
U.S. income tax positions taken in prior fiscal years, partially offset by tax benefits recorded for the release of income tax reserves associated
with settlements of income tax audits and the expiration of certain statutes of limitation. Our fiscal year 2010 income tax benefit included
$55 million of deferred tax benefit from the reversal of a portion of the U.S. valuation allowance recorded in earlier years.
Our Irish tax resident parent holding company owns various U.S. and non-U.S. subsidiaries that operate in multiple non-Irish tax
jurisdictions. Our worldwide operating income is either subject to varying rates of tax or is exempt from tax due to tax holidays or tax incentive
programs we operate under in Malaysia, Singapore, Switzerland and Thailand. These tax holidays or incentives are scheduled to expire in whole
or in part at various dates through 2020.
Our income tax provision recorded for fiscal year 2011 differed from the provision for income taxes that would be derived by applying the
Irish statutory rate of 25% to income before income taxes primarily due to the net effect of (i) tax benefits related to non-
U.S. earnings generated
in jurisdictions that are subject to tax holidays or tax incentive programs and are considered indefinitely reinvested outside of Ireland, (ii) income
tax expense related to intercompany transactions, (iii) a decrease in valuation allowance for certain deferred tax assets, and (iv) non-U.S. losses
with no tax benefit. Our benefit for income taxes recorded for the comparative fiscal year ended July 2, 2010 differed from the provision
(benefit) for income taxes that would be derived by applying the Irish statutory rate of 25% to income before income taxes primarily due to the
net effect of (i) tax benefits related to non-U.S. earnings generated in jurisdictions that are subject to tax holidays or tax incentive programs and
are considered indefinitely reinvested outside of Ireland, (ii) a decrease in valuation allowance for certain deferred tax assets, (iii) non-U.S.
losses with no tax benefit, and (iv) tax expense related to intercompany transactions.
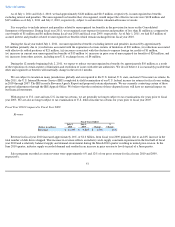
Based on our non-U.S. ownership structure and subject to (i) potential future increases in our valuation allowance for deferred tax assets;
and (ii) a future change in our intention to indefinitely reinvest earnings from our subsidiaries outside of Ireland, we anticipate that our effective
tax rate in future periods will generally be less than the Irish statutory rate.
At July 1, 2011, our deferred tax asset valuation allowance was approximately $1.1 billion.
At July 1, 2011, we had net deferred tax assets of $462 million. The realization of $455 million of these deferred tax assets is primarily
dependent on our ability to generate sufficient U.S. and certain non-U.S. taxable income in future periods. Although realization is not assured,
we believe that it is more likely than not that these deferred tax assets will be realized. The amount of deferred tax assets considered realizable,
however, may increase or decrease in subsequent periods when we re-evaluate the underlying basis for our estimates of future U.S. and certain
non-U.S. taxable income.
Approximately $364 million and $90 million of our U.S. net operating loss and tax credit carry forwards, respectively, are subject to an
aggregate annual limitation of $45 million pursuant to U.S. tax law.
56
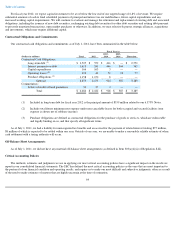
Fiscal Years Ended
(Dollars in millions)
July 1,
2011
July 2,
2010
Change
%
Change
Provision for (benefit
from) income taxes
$
68
$
(40
)
$
108
270
%