Seagate 2010 Annual Report Download - page 115
Download and view the complete annual report
Please find page 115 of the 2010 Seagate annual report below. You can navigate through the pages in the report by either clicking on the pages listed below, or by using the keyword search tool below to find specific information within the annual report.-
 1
1 -
2
-
3
-
4
-
5
-
6
-
7
-
8
-
9
-
10
-
11
-
12
-
13
-
14
-
15
-
16
-
17
-
18
-
19
-
20
-
21
-
22
-
23
-
24
-
25
-
26
-
27
-
28
-
29
-
30
-
31
-
32
-
33
-
34
-
35
-
36
-
37
-
38
-
39
-
40
-
41
-
42
-
43
-
44
-
45
-
46
-
47
-
48
-
49
-
50
-
51
-
52
-
53
-
54
-
55
-
56
-
57
-
58
-
59
-
60
-
61
-
62
-
63
-
64
-
65
-
66
-
67
-
68
-
69
-
70
-
71
-
72
-
73
-
74
-
75
-
76
-
77
-
78
-
79
-
80
-
81
-
82
-
83
-
84
-
85
-
86
-
87
-
88
-
89
-
90
-
91
-
92
-
93
-
94
-
95
-
96
-
97
-
98
-
99
-
100
-
101
-
102
-
103
-
104
-
 105
105 -
 106
106 -
 107
107 -
 108
108 -
 109
109 -
 110
110 -
 111
111 -
 112
112 -
 113
113 -
 114
114 -
 115
115 -
 116
116 -
 117
117 -
 118
118 -
 119
119 -
 120
120 -
 121
121 -
 122
122 -
 123
123 -
 124
124 -
 125
125 -
126
-
127
-
128
-
129
-
130
-
131
-
132
-
133
-
134
-
135
-
136
-
137
-
138
-
139
-
140
-
141
-
142
-
143
-
144
-
145
-
146
-
147
-
148
-
149
-
150
-
151
-
152
-
153
-
154
-
155
-
156
-
157
-
158
-
159
-
160
-
161
-
162
-
163
-
164
-
165
-
166
-
167
-
168
-
169
-
170
-
171
-
172
-
173
-
174
-
175
-
176
-
177
-
178
-
179
-
180
-
181
-
182
-
183
-
184
-
185
-
186
-
187
-
188
-
189
-
190
-
191
-
192
-
193
-
194
-
195
-
196
-
197
-
198
-
199
-
200
-
201
-
202
-
203
-
204
-
205
-
206
-
207
-
208
-
209
-
210
-
211
-
212
-
213
-
214
-
215
-
216
-
217
-
218
-
219
-
220
-
221
-
222
-
223
-
224
-
225
-
226
-
227
-
228
-
229
-
230
-
231
-
232
-
233
-
234
-
235
-
236
-
237
-
238
-
239
-
240
-
241
-
242
-
243
-
244
-
245
-
246
-
247
-
248
-
249
-
250
-
251
-
252
-
253
-
254
-
255
-
256
-
257
-
258
-
259
-
260
-
261
-
262
-
263
-
264
-
265
-
266
-
267
-
268
-
269
-
270
-
271
-
272
-
273
-
274
-
275
-
276
-
277
-
278
-
279
-
280
-
281
-
282
-
283
-
284
-
285
 |
 |

Table of Contents
SEAGATE TECHNOLOGY PLC
NOTES TO CONSOLIDATED FINANCIAL STATEMENTS—(Continued)
in the rabbi trust were approximately $84 million and $76 million, respectively, and are included in Restricted cash and investments in the
Consolidated Balance Sheets. The deferred compensation obligation related to the rabbi trust included in Accrued expenses on the accompanying
Consolidated Balance Sheets was approximately $93 million and $82 million as of July 1, 2011 and July 2, 2010, respectively.
Effective January 3, 2011, the Company cancelled its TRS, which had been used to manage the equity market risks associated with SDCP.
Currently, the Company manages its exposure to equity market risks associated with the deferred compensation liabilities by investing directly in
mutual funds that mirror the employees' investment options. The Company classified investments held to satisfy the deferred compensation
liabilities as trading securities.
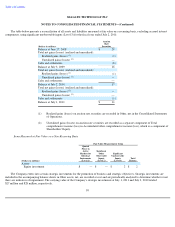
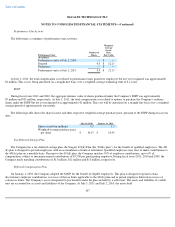
11. Earnings Per Share
The following table sets forth the computation of basic and diluted net income (loss) per share:
108
Fiscal Years Ended
(In millions, except per share data)
July 1,
2011 July 2,
2010 July 3,
2009
Numerator:
Net income (loss)
$
511
$
1,609
$
(3,125
)
Adjustment for interest expense on 6.8% Convertible Senior
Notes due April 2010
—
5
—
Net income (loss), as adjusted
$
511
$
1,614
$
(3,125
)
Number of shares used in per share calculations:
Weighted
-
average shares outstanding
451
492
490
Weighted
-
average nonvested shares
—
(
1
)
(2
)
Total shares for purpose of calculating basic net income (loss)
per share
451
491
488
Weighted
-
average effect of dilutive securities:
Employee equity award plans
16
20
—
2.375% Convertible Senior Notes due August 2012
—
1
—
6.8% Convertible Senior Notes due April 2010
—
2
—
Dilutive potential shares:
16
23
—
Total shares for purpose of calculating diluted net income (loss)
per share
467
514
488
Net income (loss) per share:
Basic net income (loss) per share
$
1.13
$
3.28
$
(6.40
)
Diluted net income (loss) per share
$
1.09
$
3.14
$
(6.40
)