Seagate 2010 Annual Report Download - page 60
Download and view the complete annual report
Please find page 60 of the 2010 Seagate annual report below. You can navigate through the pages in the report by either clicking on the pages listed below, or by using the keyword search tool below to find specific information within the annual report.-
 1
1 -
2
-
3
-
4
-
5
-
6
-
7
-
8
-
9
-
10
-
11
-
12
-
13
-
14
-
15
-
16
-
17
-
18
-
19
-
20
-
21
-
22
-
23
-
24
-
25
-
26
-
27
-
28
-
29
-
30
-
31
-
32
-
33
-
34
-
35
-
36
-
37
-
38
-
39
-
40
-
41
-
42
-
43
-
44
-
45
-
46
-
47
-
48
-
49
-
 50
50 -
 51
51 -
 52
52 -
 53
53 -
 54
54 -
 55
55 -
 56
56 -
 57
57 -
 58
58 -
 59
59 -
 60
60 -
 61
61 -
 62
62 -
 63
63 -
 64
64 -
 65
65 -
 66
66 -
 67
67 -
 68
68 -
 69
69 -
 70
70 -
71
-
72
-
73
-
74
-
75
-
76
-
77
-
78
-
79
-
80
-
81
-
82
-
83
-
84
-
85
-
86
-
87
-
88
-
89
-
90
-
91
-
92
-
93
-
94
-
95
-
96
-
97
-
98
-
99
-
100
-
101
-
102
-
103
-
104
-
105
-
106
-
107
-
108
-
109
-
110
-
111
-
112
-
113
-
114
-
115
-
116
-
117
-
118
-
119
-
120
-
121
-
122
-
123
-
124
-
125
-
126
-
127
-
128
-
129
-
130
-
131
-
132
-
133
-
134
-
135
-
136
-
137
-
138
-
139
-
140
-
141
-
142
-
143
-
144
-
145
-
146
-
147
-
148
-
149
-
150
-
151
-
152
-
153
-
154
-
155
-
156
-
157
-
158
-
159
-
160
-
161
-
162
-
163
-
164
-
165
-
166
-
167
-
168
-
169
-
170
-
171
-
172
-
173
-
174
-
175
-
176
-
177
-
178
-
179
-
180
-
181
-
182
-
183
-
184
-
185
-
186
-
187
-
188
-
189
-
190
-
191
-
192
-
193
-
194
-
195
-
196
-
197
-
198
-
199
-
200
-
201
-
202
-
203
-
204
-
205
-
206
-
207
-
208
-
209
-
210
-
211
-
212
-
213
-
214
-
215
-
216
-
217
-
218
-
219
-
220
-
221
-
222
-
223
-
224
-
225
-
226
-
227
-
228
-
229
-
230
-
231
-
232
-
233
-
234
-
235
-
236
-
237
-
238
-
239
-
240
-
241
-
242
-
243
-
244
-
245
-
246
-
247
-
248
-
249
-
250
-
251
-
252
-
253
-
254
-
255
-
256
-
257
-
258
-
259
-
260
-
261
-
262
-
263
-
264
-
265
-
266
-
267
-
268
-
269
-
270
-
271
-
272
-
273
-
274
-
275
-
276
-
277
-
278
-
279
-
280
-
281
-
282
-
283
-
284
-
285
 |
 |

Table of Contents
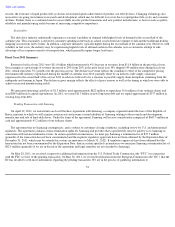
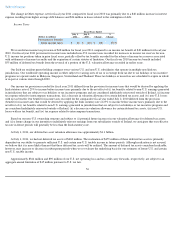
As of July 1, 2011 and July 2, 2010, we had approximately $128 million and $115 million, respectively, in unrecognized tax benefits
excluding interest and penalties. The unrecognized tax benefits that, if recognized, would impact the effective tax rate were $128 million and
$115 million as of July 1, 2011 and July 2, 2010, respectively, subject to certain future valuation allowance reversals.
It is our policy to include interest and penalties related to unrecognized tax benefits in the provision for taxes on the Consolidated
Statements of Operations. During fiscal year 2011, we recognized a net expense for interest and penalties of less than $1 million as compared to
a net benefit of $1 million and $6 million during fiscal year 2010 and fiscal year 2009, respectively. As of July 1, 2011, we had $15 million of
accrued interest and penalties related to unrecognized tax benefits which remain unchanged from fiscal year 2010.
During the fiscal year ended July 1, 2011, our unrecognized tax benefits excluding interest and penalties increased by approximately
$13 million primarily due to (i) reductions associated with the expiration of certain statutes of limitation of $10 million, (ii) reductions associated
with effectively settled positions of $21 million, (iii) increases associated with the election to expense foreign tax credits of $1 million,
(iv) increases in current year unrecognized tax benefits of $13 million (v) increases in prior year of unrecognized tax benefits of $26 million, and
(vi) increases from other activity, including non-U.S. exchange losses, of $4 million.
During the 12 months beginning July 2, 2011, we expect to reduce our unrecognized tax benefits by approximately $10 million as a result
of the expiration of certain statutes of limitation and resolution of issues with relevant authorities. We do not believe it is reasonably possible that
other unrecognized tax benefits will materially change in the next 12 months.
We are subject to taxation in many jurisdictions globally and are required to file U.S. federal, U.S. state, and non-
U.S income tax returns. In
May 2011, the U.S. Internal Revenue Service (IRS) completed its field examination of our U.S. federal income tax returns for fiscal years ending
in 2005 through 2007. The IRS issued a Revenue Agent's Report and proposed certain adjustments. We are currently contesting certain of these
proposed adjustments through the IRS Appeals Office. We believe that the resolution of these disputed issues will have no material impact on
our financial statements.
With respect to U.S. state and non-U.S. income tax returns, we are generally no longer subject to tax examinations for years prior to fiscal
year 2003. We are also no longer subject to tax examination of U.S. federal income tax returns for years prior to fiscal year 2005.
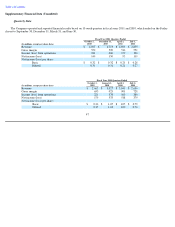
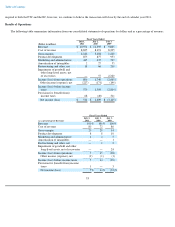
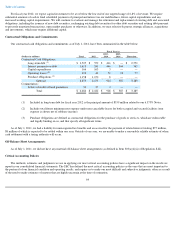
Fiscal Year 2010 Compared to Fiscal Year 2009
Revenue
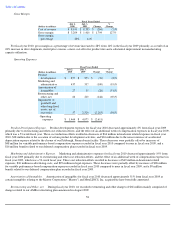
Revenue in fiscal year 2010 increased approximately 16%, or $1.6 billion, from fiscal year 2009 primarily due to an 18% increase in the
total number of disk drives shipped. This increase in revenue reflects an industry-wide supply constraint experienced in the first half of fiscal
year 2010 and a relatively balanced supply and demand environment during the March 2010 quarter resulting in muted price erosion. In the
June 2010 quarter, industry supply exceeded demand and resulted in an increase in price erosion to levels typical of a June quarter.
Sales programs recorded as contra revenue were approximately 6% and 12% of our gross revenue for fiscal years 2010 and 2009,
respectively.
57
Fiscal Years Ended
(Dollars in millions)
July 2,
2010
July 3,
2009
Change
%
Change
Revenue
$
11,395
$
9,805
$
1,590
16
%