Seagate 2010 Annual Report Download - page 58
Download and view the complete annual report
Please find page 58 of the 2010 Seagate annual report below. You can navigate through the pages in the report by either clicking on the pages listed below, or by using the keyword search tool below to find specific information within the annual report.-
 1
1 -
2
-
3
-
4
-
5
-
6
-
7
-
8
-
9
-
10
-
11
-
12
-
13
-
14
-
15
-
16
-
17
-
18
-
19
-
20
-
21
-
22
-
23
-
24
-
25
-
26
-
27
-
28
-
29
-
30
-
31
-
32
-
33
-
34
-
35
-
36
-
37
-
38
-
39
-
40
-
41
-
42
-
43
-
44
-
45
-
46
-
47
-
 48
48 -
 49
49 -
 50
50 -
 51
51 -
 52
52 -
 53
53 -
 54
54 -
 55
55 -
 56
56 -
 57
57 -
 58
58 -
 59
59 -
 60
60 -
 61
61 -
 62
62 -
 63
63 -
 64
64 -
 65
65 -
 66
66 -
 67
67 -
 68
68 -
69
-
70
-
71
-
72
-
73
-
74
-
75
-
76
-
77
-
78
-
79
-
80
-
81
-
82
-
83
-
84
-
85
-
86
-
87
-
88
-
89
-
90
-
91
-
92
-
93
-
94
-
95
-
96
-
97
-
98
-
99
-
100
-
101
-
102
-
103
-
104
-
105
-
106
-
107
-
108
-
109
-
110
-
111
-
112
-
113
-
114
-
115
-
116
-
117
-
118
-
119
-
120
-
121
-
122
-
123
-
124
-
125
-
126
-
127
-
128
-
129
-
130
-
131
-
132
-
133
-
134
-
135
-
136
-
137
-
138
-
139
-
140
-
141
-
142
-
143
-
144
-
145
-
146
-
147
-
148
-
149
-
150
-
151
-
152
-
153
-
154
-
155
-
156
-
157
-
158
-
159
-
160
-
161
-
162
-
163
-
164
-
165
-
166
-
167
-
168
-
169
-
170
-
171
-
172
-
173
-
174
-
175
-
176
-
177
-
178
-
179
-
180
-
181
-
182
-
183
-
184
-
185
-
186
-
187
-
188
-
189
-
190
-
191
-
192
-
193
-
194
-
195
-
196
-
197
-
198
-
199
-
200
-
201
-
202
-
203
-
204
-
205
-
206
-
207
-
208
-
209
-
210
-
211
-
212
-
213
-
214
-
215
-
216
-
217
-
218
-
219
-
220
-
221
-
222
-
223
-
224
-
225
-
226
-
227
-
228
-
229
-
230
-
231
-
232
-
233
-
234
-
235
-
236
-
237
-
238
-
239
-
240
-
241
-
242
-
243
-
244
-
245
-
246
-
247
-
248
-
249
-
250
-
251
-
252
-
253
-
254
-
255
-
256
-
257
-
258
-
259
-
260
-
261
-
262
-
263
-
264
-
265
-
266
-
267
-
268
-
269
-
270
-
271
-
272
-
273
-
274
-
275
-
276
-
277
-
278
-
279
-
280
-
281
-
282
-
283
-
284
-
285
 |
 |

Table of Contents
For fiscal year 2011, gross margin as a percentage of revenue decreased to 20% from 28% in the prior fiscal year, primarily due to price
erosion. In addition, gross margin was negatively impacted by delays in ramping to maturity for new products, which unfavorably affected our
manufacturing yields.
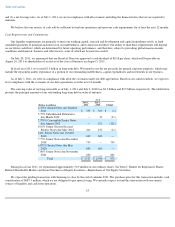
Operating Expenses
Product Development Expense. Product development expenses for fiscal year 2011 were relatively flat from fiscal year 2010, reflecting a
$28 million decrease in variable performance-based compensation, offset by an $18 million increase in spending for new programs and an
$8 million decrease in research grants.
Marketing and Administrative Expense. The increase in Marketing and administrative expenses for fiscal year 2011 compared to fiscal
year 2010 was due to a $13 million increase related to Samsung acquisition expenses, $10 million increase in litigation related expenses, and a
net $11 million reduction in total compensation expenses, part of which included a $23 million decrease in variable performance-based
compensation.
Amortization of Intangibles. Amortization of intangibles for fiscal year 2011 decreased approximately 93% from fiscal year 2010 as
certain intangibles relating to the MetaLINCS, Inc. acquisitions have been fully amortized.
Restructuring and Other, net. During fiscal year 2011, we recorded restructuring and other charges of $18 million primarily associated
with previously announced restructuring activities. Restructuring and Other, net decreased approximately $48 million when compared to the
prior fiscal year, which included a $39 million charge for our AMK restructuring plan announced in August 2009 and an $18 million charge
related to our Pittsburgh, Pennsylvania facility.
Impairment of Long-Lived Assets. During fiscal year 2011, we did not record any impairment charge related to our long-lived assets.
Impairment of long-lived assets decreased approximately $57 million when compared to the prior fiscal year, which included an impairment
charge to adjust the carrying value of certain assets held for sale to their estimated fair value, less cost to sell.
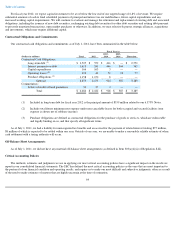
Other Income (Expense), net
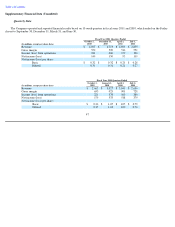
55
Fiscal Years Ended
(Dollars in millions)
July 1,
2011 July 2,
2010 Change %
Change
Product development
$
875
$
877
$
(2
)
—
Marketing and
administrative
445
437
8
2
%
Amortization of
intangibles
2
27
(25
)
(93
)%
Restructuring and
other, net
18
66
(48
)
(73
)%
Impairment of long
-
lived assets
—
57
(57
)
(100
)%
Operating expenses
$
1,340
$
1,464
$
(124
)
Fiscal Years Ended
(Dollars in millions)
July 1,
2011
July 2,
2010
Change
%
Change
Other expense, net
$
(227
)
$
(171
)
$
(56
)
33
%