Seagate 2010 Annual Report Download - page 64
Download and view the complete annual report
Please find page 64 of the 2010 Seagate annual report below. You can navigate through the pages in the report by either clicking on the pages listed below, or by using the keyword search tool below to find specific information within the annual report.-
 1
1 -
2
-
3
-
4
-
5
-
6
-
7
-
8
-
9
-
10
-
11
-
12
-
13
-
14
-
15
-
16
-
17
-
18
-
19
-
20
-
21
-
22
-
23
-
24
-
25
-
26
-
27
-
28
-
29
-
30
-
31
-
32
-
33
-
34
-
35
-
36
-
37
-
38
-
39
-
40
-
41
-
42
-
43
-
44
-
45
-
46
-
47
-
48
-
49
-
50
-
51
-
52
-
53
-
 54
54 -
 55
55 -
 56
56 -
 57
57 -
 58
58 -
 59
59 -
 60
60 -
 61
61 -
 62
62 -
 63
63 -
 64
64 -
 65
65 -
 66
66 -
 67
67 -
 68
68 -
 69
69 -
 70
70 -
 71
71 -
 72
72 -
 73
73 -
 74
74 -
75
-
76
-
77
-
78
-
79
-
80
-
81
-
82
-
83
-
84
-
85
-
86
-
87
-
88
-
89
-
90
-
91
-
92
-
93
-
94
-
95
-
96
-
97
-
98
-
99
-
100
-
101
-
102
-
103
-
104
-
105
-
106
-
107
-
108
-
109
-
110
-
111
-
112
-
113
-
114
-
115
-
116
-
117
-
118
-
119
-
120
-
121
-
122
-
123
-
124
-
125
-
126
-
127
-
128
-
129
-
130
-
131
-
132
-
133
-
134
-
135
-
136
-
137
-
138
-
139
-
140
-
141
-
142
-
143
-
144
-
145
-
146
-
147
-
148
-
149
-
150
-
151
-
152
-
153
-
154
-
155
-
156
-
157
-
158
-
159
-
160
-
161
-
162
-
163
-
164
-
165
-
166
-
167
-
168
-
169
-
170
-
171
-
172
-
173
-
174
-
175
-
176
-
177
-
178
-
179
-
180
-
181
-
182
-
183
-
184
-
185
-
186
-
187
-
188
-
189
-
190
-
191
-
192
-
193
-
194
-
195
-
196
-
197
-
198
-
199
-
200
-
201
-
202
-
203
-
204
-
205
-
206
-
207
-
208
-
209
-
210
-
211
-
212
-
213
-
214
-
215
-
216
-
217
-
218
-
219
-
220
-
221
-
222
-
223
-
224
-
225
-
226
-
227
-
228
-
229
-
230
-
231
-
232
-
233
-
234
-
235
-
236
-
237
-
238
-
239
-
240
-
241
-
242
-
243
-
244
-
245
-
246
-
247
-
248
-
249
-
250
-
251
-
252
-
253
-
254
-
255
-
256
-
257
-
258
-
259
-
260
-
261
-
262
-
263
-
264
-
265
-
266
-
267
-
268
-
269
-
270
-
271
-
272
-
273
-
274
-
275
-
276
-
277
-
278
-
279
-
280
-
281
-
282
-
283
-
284
-
285
 |
 |

Table of Contents
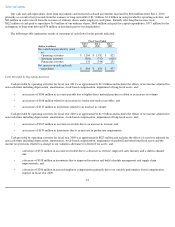
Our cash and cash equivalents, short-term investments and restricted cash and investments increased by $624 million from July 2, 2010
primarily as a result of net proceeds from the issuance of long-term debt of $1.3 billion, $1.3 billion in cash provided by operating activities, and
$83 million in cash received from the issuance of ordinary shares under employee stock plans. Partially offsetting this increase were
$822 million of cash paid to repurchase 56.9 million of our ordinary shares, $843 million cash paid for capital expenditures, $377 million for the
redemption of long-term debt and $74 million in dividends paid to our shareholders.
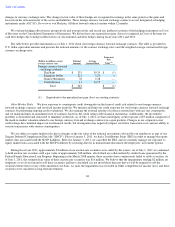
The following table summarizes results of statement of cash flows for the periods indicated:
Cash Provided by Operating Activities
Cash provided by operating activities for fiscal year 2011 was approximately $1.3 billion and includes the effects of net income adjusted for
non-cash items including depreciation, amortization, stock-based compensation, impairment of long-lived assets, and:
• an increase of $386 million in accounts payable due to higher direct material purchases related to an increase in volume;
• an increase of $168 million related to an increase in vendor non-trade receivables; and
•
an increase of $115 million in inventories related to an increase in volume.
Cash provided by operating activities for fiscal year 2010 was approximately $1.9 billion and includes the effects of net income adjusted for
non-cash items including depreciation, amortization, stock-based compensation, impairment of long-lived assets, and:
• an increase of $367 million in accounts receivable due to an increase in revenue; and
•
an increase of $170 million in inventories due to an increase in production requirements.
Cash provided by operating activities for fiscal year 2009 was approximately $823 million and includes the effects of a net loss adjusted for
non-cash items including depreciation, amortization, stock-based compensation, impairment of goodwill and other long-lived assets and the
income tax provision related to a change in our valuation allowance for deferred tax assets, and:
•
a decrease of $372 million in accounts receivable due to a decrease in revenue, improved sales linearity and a shift in channel
mix;
• a decrease of $358 million in inventories due to improved inventory and build schedule management and supply chain
improvements; and
• a decrease of $296 million in accrued employee compensation primarily due to no variable performance-based compensation
expense in fiscal year 2009.
61
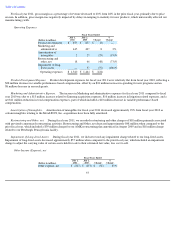
Fiscal Years Ended
(Dollars in millions)
July 1,
2011
July 2,
2010
July 3,
2009
Net cash flow provided by (used
in):
Operating activities
$
1,264
$
1,932
$
823
Investing activities
(981
)
(752
)
(618
)
Financing activities
131
(344
)
232
Net increase in cash and cash
equivalents
$
414
$
836
$
437