Seagate 2010 Annual Report Download - page 116
Download and view the complete annual report
Please find page 116 of the 2010 Seagate annual report below. You can navigate through the pages in the report by either clicking on the pages listed below, or by using the keyword search tool below to find specific information within the annual report.-
 1
1 -
2
-
3
-
4
-
5
-
6
-
7
-
8
-
9
-
10
-
11
-
12
-
13
-
14
-
15
-
16
-
17
-
18
-
19
-
20
-
21
-
22
-
23
-
24
-
25
-
26
-
27
-
28
-
29
-
30
-
31
-
32
-
33
-
34
-
35
-
36
-
37
-
38
-
39
-
40
-
41
-
42
-
43
-
44
-
45
-
46
-
47
-
48
-
49
-
50
-
51
-
52
-
53
-
54
-
55
-
56
-
57
-
58
-
59
-
60
-
61
-
62
-
63
-
64
-
65
-
66
-
67
-
68
-
69
-
70
-
71
-
72
-
73
-
74
-
75
-
76
-
77
-
78
-
79
-
80
-
81
-
82
-
83
-
84
-
85
-
86
-
87
-
88
-
89
-
90
-
91
-
92
-
93
-
94
-
95
-
96
-
97
-
98
-
99
-
100
-
101
-
102
-
103
-
104
-
105
-
 106
106 -
 107
107 -
 108
108 -
 109
109 -
 110
110 -
 111
111 -
 112
112 -
 113
113 -
 114
114 -
 115
115 -
 116
116 -
 117
117 -
 118
118 -
 119
119 -
 120
120 -
 121
121 -
 122
122 -
 123
123 -
 124
124 -
 125
125 -
 126
126 -
127
-
128
-
129
-
130
-
131
-
132
-
133
-
134
-
135
-
136
-
137
-
138
-
139
-
140
-
141
-
142
-
143
-
144
-
145
-
146
-
147
-
148
-
149
-
150
-
151
-
152
-
153
-
154
-
155
-
156
-
157
-
158
-
159
-
160
-
161
-
162
-
163
-
164
-
165
-
166
-
167
-
168
-
169
-
170
-
171
-
172
-
173
-
174
-
175
-
176
-
177
-
178
-
179
-
180
-
181
-
182
-
183
-
184
-
185
-
186
-
187
-
188
-
189
-
190
-
191
-
192
-
193
-
194
-
195
-
196
-
197
-
198
-
199
-
200
-
201
-
202
-
203
-
204
-
205
-
206
-
207
-
208
-
209
-
210
-
211
-
212
-
213
-
214
-
215
-
216
-
217
-
218
-
219
-
220
-
221
-
222
-
223
-
224
-
225
-
226
-
227
-
228
-
229
-
230
-
231
-
232
-
233
-
234
-
235
-
236
-
237
-
238
-
239
-
240
-
241
-
242
-
243
-
244
-
245
-
246
-
247
-
248
-
249
-
250
-
251
-
252
-
253
-
254
-
255
-
256
-
257
-
258
-
259
-
260
-
261
-
262
-
263
-
264
-
265
-
266
-
267
-
268
-
269
-
270
-
271
-
272
-
273
-
274
-
275
-
276
-
277
-
278
-
279
-
280
-
281
-
282
-
283
-
284
-
285
 |
 |

Table of Contents
SEAGATE TECHNOLOGY PLC
NOTES TO CONSOLIDATED FINANCIAL STATEMENTS—(Continued)
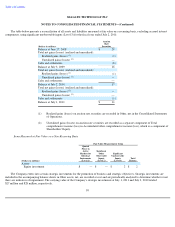
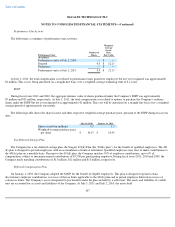
The following potential shares were excluded from the computation of diluted net income (loss) per share as their effect would have been
anti-dilutive:
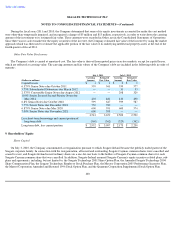
12. Business Segment and Geographic Information
The Company has concluded that its manufacture and distribution of disk drives constitutes one reporting segment. The Company's
manufacturing operations are based on technology platforms that are used to produce various disk drive products that serve multiple disk drive
applications and markets. The Company's main technology platforms are primarily focused around areal density of media and read/write head
technologies. In addition, the Company also invests in certain other technology platforms including motors, servo formatting read/write
channels, solid state technologies and sealed drive technologies. The Company has determined that its Chief Executive Officer is the Company's
chief operating decision maker (CODM) as he is responsible for reviewing and approving investments in the Company's technology platforms
and manufacturing infrastructure.
In the fiscal year 2011, Hewlett-
Packard Company accounted for approximately 15% of consolidated revenue, while Dell Inc. accounted for
approximately 13% of consolidated revenue. In each of fiscal years 2010 and 2009, Hewlett-Packard Company accounted for approximately
16% of consolidated revenue, while Dell Inc. accounted for approximately 11% of consolidated revenue.
Other long-lived assets consist of property, equipment and leasehold improvements, capital leases, equity investments and other non-
current
assets as recorded by the Company's operations in each area.
109
Fiscal Years Ended
(In millions)
July 1,
2011 July 2,
2010 July 3,
2009
Employee equity award plans
15
20
57
6.8% Convertible Senior Notes due
April 2010
—
—
4