Seagate 2010 Annual Report Download - page 72
Download and view the complete annual report
Please find page 72 of the 2010 Seagate annual report below. You can navigate through the pages in the report by either clicking on the pages listed below, or by using the keyword search tool below to find specific information within the annual report.-
 1
1 -
2
-
3
-
4
-
5
-
6
-
7
-
8
-
9
-
10
-
11
-
12
-
13
-
14
-
15
-
16
-
17
-
18
-
19
-
20
-
21
-
22
-
23
-
24
-
25
-
26
-
27
-
28
-
29
-
30
-
31
-
32
-
33
-
34
-
35
-
36
-
37
-
38
-
39
-
40
-
41
-
42
-
43
-
44
-
45
-
46
-
47
-
48
-
49
-
50
-
51
-
52
-
53
-
54
-
55
-
56
-
57
-
58
-
59
-
60
-
61
-
 62
62 -
 63
63 -
 64
64 -
 65
65 -
 66
66 -
 67
67 -
 68
68 -
 69
69 -
 70
70 -
 71
71 -
 72
72 -
 73
73 -
 74
74 -
 75
75 -
 76
76 -
 77
77 -
 78
78 -
 79
79 -
 80
80 -
 81
81 -
 82
82 -
83
-
84
-
85
-
86
-
87
-
88
-
89
-
90
-
91
-
92
-
93
-
94
-
95
-
96
-
97
-
98
-
99
-
100
-
101
-
102
-
103
-
104
-
105
-
106
-
107
-
108
-
109
-
110
-
111
-
112
-
113
-
114
-
115
-
116
-
117
-
118
-
119
-
120
-
121
-
122
-
123
-
124
-
125
-
126
-
127
-
128
-
129
-
130
-
131
-
132
-
133
-
134
-
135
-
136
-
137
-
138
-
139
-
140
-
141
-
142
-
143
-
144
-
145
-
146
-
147
-
148
-
149
-
150
-
151
-
152
-
153
-
154
-
155
-
156
-
157
-
158
-
159
-
160
-
161
-
162
-
163
-
164
-
165
-
166
-
167
-
168
-
169
-
170
-
171
-
172
-
173
-
174
-
175
-
176
-
177
-
178
-
179
-
180
-
181
-
182
-
183
-
184
-
185
-
186
-
187
-
188
-
189
-
190
-
191
-
192
-
193
-
194
-
195
-
196
-
197
-
198
-
199
-
200
-
201
-
202
-
203
-
204
-
205
-
206
-
207
-
208
-
209
-
210
-
211
-
212
-
213
-
214
-
215
-
216
-
217
-
218
-
219
-
220
-
221
-
222
-
223
-
224
-
225
-
226
-
227
-
228
-
229
-
230
-
231
-
232
-
233
-
234
-
235
-
236
-
237
-
238
-
239
-
240
-
241
-
242
-
243
-
244
-
245
-
246
-
247
-
248
-
249
-
250
-
251
-
252
-
253
-
254
-
255
-
256
-
257
-
258
-
259
-
260
-
261
-
262
-
263
-
264
-
265
-
266
-
267
-
268
-
269
-
270
-
271
-
272
-
273
-
274
-
275
-
276
-
277
-
278
-
279
-
280
-
281
-
282
-
283
-
284
-
285
 |
 |

Table of Contents
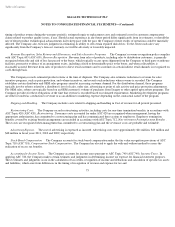
changes in currency exchange rates. The changes in fair value of these hedges are recognized in earnings in the same period as the gains and
losses from the remeasurement of the assets and liabilities. These foreign currency forward exchange contracts are not designated as hedging
instruments under ASC 815, Derivatives and Hedging. All these forward contracts mature within 12 months.
We evaluate hedging effectiveness prospectively and retrospectively and record any ineffective portion of the hedging instruments in Costs
of Revenue on the Consolidated Statements of Operations. We did not have any material net gains (losses) recognized in Costs of Revenue for
cash flow hedges due to hedge ineffectiveness or discontinued cash flow hedges during fiscal years 2011 and 2010.
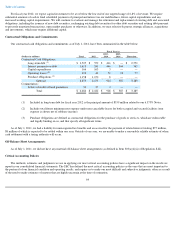
The table below provides information as of July 1, 2011 about our foreign currency forward exchange contracts. The table is provided in
U.S. dollar equivalent amounts and presents the notional amounts (at the contract exchange rates) and the weighted average contractual foreign
currency exchange rates.
Other Market Risks. We have exposure to counterparty credit downgrades in the form of credit risk related to our foreign currency
forward exchange contracts and our fixed income portfolio. We monitor and limit our credit exposure for our foreign currency forward exchange
contracts by performing ongoing credit evaluations. We also manage the notional amount of contracts entered into with any one counterparty,
and we maintain limits on maximum tenor of contracts based on the credit rating of the financial institutions. Additionally, the investment
portfolio is diversified and structured to minimize credit risk. As of July 1, 2011, we had counterparty credit exposure of $5 million comprised of
the mark-to-market valuation related to our foreign currency forward exchange contracts in a gain position. Changes in our corporate issuer
credit ratings have minimal impact on our financial results, but downgrades may negatively impact our future transaction costs and our ability to
execute transactions with various counterparties.
We are subject to equity market risks due to changes in the fair value of the notional investments selected by our employees as part of our
Seagate Deferred Compensation Plan (the "SDCP"). Prior to January 3, 2011, we had a Total Return Swap (TRS) in order to manage the equity
market risks associated with the SDCP liabilities. Effective January 3, 2011, we cancelled the TRS, and we currently manage our exposure to
equity market risks associated with the SDCP liabilities by investing directly in mutual funds that mirror the employees' investment options.
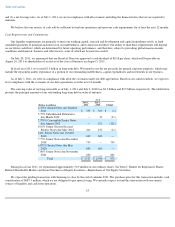
During fiscal year 2011, approximately $1 million of our auction rate securities were called by the issuers. As of July 1, 2011 we continued
to hold auction rate securities with a par value of approximately $18 million, all of which are collateralized by student loans guaranteed by the
Federal Family Education Loan Program. Beginning in the March 2008 quarter, these securities have continuously failed to settle at auction. As
of July 1, 2011, the estimated fair value of these auction rate securities was $16 million. We believe that the impairments totaling $2 million are
temporary as we do not intend to sell these securities and have concluded it is not more likely than not that we will be required to sell the
securities before the recovery of the amortized cost basis. As such, the impairment was recorded in Other comprehensive income (loss) and these
securities were classified as long-term investments.
68
(Dollars in millions, except
average contract rate)
Notional
Amount Average
Contract Rate
Estimated
Fair
Value
(1)
Foreign currency forward
exchange contracts:
Thai Baht
$
333
30.35
$
(5
)
Singapore Dollar
221
1.25
4
Chinese Renminbi
78
6.38
—
Czech Koruna
11
16.95
—
Total
$
643
$
(1
)
(1)
Equivalent to the unrealized net gain (loss) on existing contracts.