NVIDIA 2013 Annual Report Download - page 88
Download and view the complete annual report
Please find page 88 of the 2013 NVIDIA annual report below. You can navigate through the pages in the report by either clicking on the pages listed below, or by using the keyword search tool below to find specific information within the annual report.-
 1
1 -
2
-
3
-
4
-
5
-
6
-
7
-
8
-
9
-
10
-
11
-
12
-
13
-
14
-
15
-
16
-
17
-
18
-
19
-
20
-
21
-
22
-
23
-
24
-
25
-
26
-
27
-
28
-
29
-
30
-
31
-
32
-
33
-
34
-
35
-
36
-
37
-
38
-
39
-
40
-
41
-
42
-
43
-
44
-
45
-
46
-
47
-
48
-
49
-
50
-
51
-
52
-
53
-
54
-
55
-
56
-
57
-
58
-
59
-
60
-
61
-
62
-
63
-
64
-
65
-
66
-
67
-
68
-
69
-
70
-
71
-
72
-
73
-
74
-
75
-
76
-
77
-
 78
78 -
 79
79 -
 80
80 -
 81
81 -
 82
82 -
 83
83 -
 84
84 -
 85
85 -
 86
86 -
 87
87 -
 88
88 -
 89
89 -
 90
90 -
 91
91 -
 92
92 -
 93
93 -
 94
94 -
 95
95 -
 96
96 -
 97
97 -
 98
98 -
99
-
100
-
101
-
102
-
103
-
104
-
105
-
106
-
107
-
108
-
109
-
110
-
111
-
112
-
113
-
114
-
115
-
116
-
117
-
118
-
119
-
120
-
121
-
122
-
123
-
124
-
125
-
126
-
127
-
128
-
129
-
130
-
131
-
132
-
133
-
134
-
135
-
136
-
137
-
138
-
139
-
140
-
141
-
142
-
143
-
144
-
145
-
146
-
147
-
148
-
149
-
150
-
151
-
152
-
153
-
154
-
155
-
156
-
157
-
158
-
159
-
160
-
161
-
162
-
163
-
164
-
165
-
166
-
167
-
168
-
169
-
170
-
171
-
172
-
173
-
174
-
175
-
176
-
177
-
178
-
179
-
180
-
181
-
182
-
183
-
184
-
185
-
186
-
187
-
188
-
189
-
190
-
191
-
192
-
193
-
194
-
195
-
196
-
197
-
198
-
199
-
200
-
201
-
202
-
203
-
204
-
205
-
206
-
207
-
208
-
209
-
210
-
211
-
212
-
213
-
214
-
215
-
216
-
217
-
218
-
219
-
220
-
221
-
222
-
223
-
224
-
225
-
226
-
227
-
228
-
229
-
230
-
231
-
232
-
233
-
234
-
235
-
236
-
237
-
238
-
239
-
240
-
241
-
242
-
243
-
244
-
245
-
246
-
247
-
248
-
249
-
250
-
251
-
252
-
253
-
254
-
255
-
256
-
257
-
258
-
259
-
260
-
261
-
262
-
263
-
264
 |
 |

70
____________
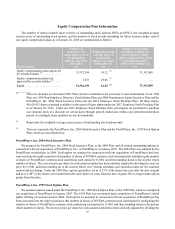
(1) Reflects the maximum number of PSUs eligible to vest, as the number of PSUs achieved was not determined as of the end of fiscal
year 2014.
(2) Includes the cancellation of 105,509 of PSUs which terminated on February 11, 2014.
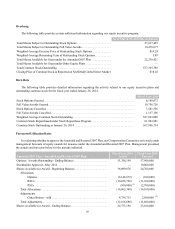
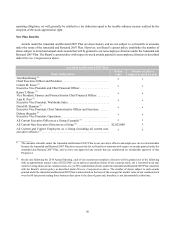
There were 567,996,734 shares of common stock outstanding as of the end of fiscal year 2014. We estimate there will
be 540,000,000 to 560,000,000 shares of common stock outstanding as of the end of fiscal year 2015.
In addition, our Compensation Committee reviewed certain actuals and forecasts of grant utilization for different
categories of grants over the periods indicated, as summarized below. These actuals and forecasts included grants to executive
and employee new hires, annual performance grants to existing eligible employees, and initial and annual grants for non-
employee directors.
Amended 2007 Plan / Amended and Restated 2007 Plan
Fiscal Year 2014
Actual
Fiscal Year 2015
Forecast
Option Grants
New Hire and Performance. . . . . . . . . . . . . . . . . . . . . . . . . . . . . . . . 5,678,048 —
Director . . . . . . . . . . . . . . . . . . . . . . . . . . . . . . . . . . . . . . . . . . . . . . . 470,624 100,000
Subtotal Option Grants . . . . . . . . . . . . . . . . . . . . . . . . . . . . . . . . . . . . . 6,148,672 100,000
RSU Grants
New Hire and Performance. . . . . . . . . . . . . . . . . . . . . . . . . . . . . . . . 10,388,942 1,775,000
Director . . . . . . . . . . . . . . . . . . . . . . . . . . . . . . . . . . . . . . . . . . . . . . . 67,784 100,000
Subtotal RSU Grants . . . . . . . . . . . . . . . . . . . . . . . . . . . . . . . . . . . . . . . 10,456,726 11,300,000
PSU Grants
New Hire and Performance. . . . . . . . . . . . . . . . . . . . . . . . . . . . . . . . 300,000 (1) 2,700,000
Subtotal PSU Grants . . . . . . . . . . . . . . . . . . . . . . . . . . . . . . . . . . . . . . . 300,000 2,700,000
Total. . . . . . . . . . . . . . . . . . . . . . . . . . . . . . . . . . . . . . . . . . . . . . . . . . . . 16,905,398 14,100,000
____________
(1) Reflects the maximum number of PSUs eligible to vest, as the number of PSUs achieved was not determined as of the end of fiscal
year 2014.
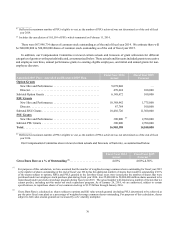
Our Compensation Committee also reviewed certain actuals and forecasts of burn rate, as summarized below.
Fiscal Year 2014
Actual
Fiscal Year 2015
Forecast (1)
Gross Burn Rate as a % of Outstanding (2). . . . . . . . . . . . . . . . . . . . . . 4.60% 4.00%-4.50%
(1) For purposes of this calculation, we have assumed that the number of weighted-average common shares outstanding for fiscal year 2015
is the number of shares outstanding at the end of fiscal year 2014 plus the additional number of shares that would be outstanding if 25%
of the shares subject to options, RSUs and PSUs granted in the last three fiscal years were issued plus the number of shares that were
purchased under our employee stock purchase plan during fiscal year 2014, less 25,000,000 to 50,000,000 million shares assumed to be
repurchased under our stock repurchase program during fiscal year 2015. The actual number will depend on a number of factors that we
cannot predict, including activity under our stock repurchase program. As of January 26, 2014, we are authorized, subject to certain
specifications, to repurchase shares of our common stock up to $1.25 billion through January 2016.
(2) Gross Burn Rate is calculated as: shares subject to options and full value awards granted (including PSUs determined to be achieved as
per the prior fiscal year plan) as a percentage of weighted-average common shares outstanding. For purposes of this calculation, shares
subject to full value awards granted are increased by a 2x volatility multiplier.