NVIDIA 2013 Annual Report Download - page 241
Download and view the complete annual report
Please find page 241 of the 2013 NVIDIA annual report below. You can navigate through the pages in the report by either clicking on the pages listed below, or by using the keyword search tool below to find specific information within the annual report.-
 1
1 -
2
-
3
-
4
-
5
-
6
-
7
-
8
-
9
-
10
-
11
-
12
-
13
-
14
-
15
-
16
-
17
-
18
-
19
-
20
-
21
-
22
-
23
-
24
-
25
-
26
-
27
-
28
-
29
-
30
-
31
-
32
-
33
-
34
-
35
-
36
-
37
-
38
-
39
-
40
-
41
-
42
-
43
-
44
-
45
-
46
-
47
-
48
-
49
-
50
-
51
-
52
-
53
-
54
-
55
-
56
-
57
-
58
-
59
-
60
-
61
-
62
-
63
-
64
-
65
-
66
-
67
-
68
-
69
-
70
-
71
-
72
-
73
-
74
-
75
-
76
-
77
-
78
-
79
-
80
-
81
-
82
-
83
-
84
-
85
-
86
-
87
-
88
-
89
-
90
-
91
-
92
-
93
-
94
-
95
-
96
-
97
-
98
-
99
-
100
-
101
-
102
-
103
-
104
-
105
-
106
-
107
-
108
-
109
-
110
-
111
-
112
-
113
-
114
-
115
-
116
-
117
-
118
-
119
-
120
-
121
-
122
-
123
-
124
-
125
-
126
-
127
-
128
-
129
-
130
-
131
-
132
-
133
-
134
-
135
-
136
-
137
-
138
-
139
-
140
-
141
-
142
-
143
-
144
-
145
-
146
-
147
-
148
-
149
-
150
-
151
-
152
-
153
-
154
-
155
-
156
-
157
-
158
-
159
-
160
-
161
-
162
-
163
-
164
-
165
-
166
-
167
-
168
-
169
-
170
-
171
-
172
-
173
-
174
-
175
-
176
-
177
-
178
-
179
-
180
-
181
-
182
-
183
-
184
-
185
-
186
-
187
-
188
-
189
-
190
-
191
-
192
-
193
-
194
-
195
-
196
-
197
-
198
-
199
-
200
-
201
-
202
-
203
-
204
-
205
-
206
-
207
-
208
-
209
-
210
-
211
-
212
-
213
-
214
-
215
-
216
-
217
-
218
-
219
-
220
-
221
-
222
-
223
-
224
-
225
-
226
-
227
-
228
-
229
-
230
-
 231
231 -
 232
232 -
 233
233 -
 234
234 -
 235
235 -
 236
236 -
 237
237 -
 238
238 -
 239
239 -
 240
240 -
 241
241 -
 242
242 -
 243
243 -
 244
244 -
 245
245 -
 246
246 -
 247
247 -
 248
248 -
 249
249 -
 250
250 -
 251
251 -
252
-
253
-
254
-
255
-
256
-
257
-
258
-
259
-
260
-
261
-
262
-
263
-
264
 |
 |

NVIDIA CORPORATION AND SUBSIDIARIES
NOTES TO THE CONSOLIDATED FINANCIAL STATEMENTS
(Continued)
97
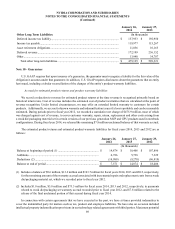
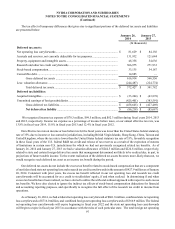
The tax effect of temporary differences that gives rise to significant portions of the deferred tax assets and liabilities
are presented below:
January 26,
2014 January 27,
2013
(In thousands)
Deferred tax assets:
Net operating loss carryforwards.................................................................................... $ 81,629 $ 84,156
Accruals and reserves, not currently deductible for tax purposes .................................. 131,932 121,644
Property, equipment and intangible assets...................................................................... 48,358 54,636
Research and other tax credit carryforwards .................................................................. 306,975 271,933
Stock-based compensation.............................................................................................. 33,135 34,187
Convertible debt.............................................................................................................. 14,885 —
Gross deferred tax assets .................................................................................... 616,914 566,556
Less: valuation allowance............................................................................................... (244,487)(224,774)
Total deferred tax assets...................................................................................... $ 372,427 $ 341,782
Deferred tax liabilities:
Acquired intangibles....................................................................................................... $(33,244) $ (43,878)
Unremitted earnings of foreign subsidiaries................................................................... (425,401)(383,591)
Gross deferred tax liabilities............................................................................... $(458,645) $ (427,469)
Net deferred tax liability .................................................................................. $(86,218) $ (85,687)
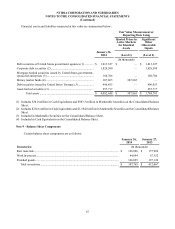
We recognized income tax expense of $70.3 million, $99.5 million, and $82.3 million during fiscal years 2014, 2013
and 2012, respectively. Income tax expense as a percentage of income before taxes, or our annual effective tax rate, was
13.8% in fiscal year 2014, 15.0% in fiscal year 2013 and 12.4% in fiscal year 2012.
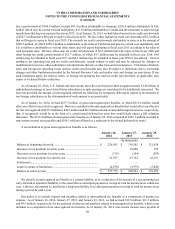
Our effective tax rate on income or loss before tax for the fiscal years was lower than the United States federal statutory
rate of 35% due to income or loss earned in jurisdictions, including British Virgin Islands, Hong Kong, China, Taiwan and
United Kingdom, where the tax rate is lower than the United States federal statutory tax rate of 35%, favorable recognition
in these fiscal years of the U.S. federal R&D tax credit and release of tax reserves as a result of the expiration of statutes
of limitations in certain non-U.S. jurisdictions for which we had not previously recognized related tax benefits. As of
January 26, 2014 and January 27, 2013 we had a valuation allowance of $244.5 million and $224.8 million, respectively,
related to state and certain foreign deferred tax assets that management determined not likely to be realized due, in part, to
projections of future taxable income. To the extent realization of the deferred tax assets becomes more-likely-than-not, we
would recognize such deferred tax asset as an income tax benefit during the period.
Our deferred tax assets do not include the excess tax benefit related to stock-based compensation that are a component
of our federal and state net operating loss and research tax credit carryforwards in the amount of $427.9 million as of January
26, 2014. Consistent with prior years, the excess tax benefit reflected in our net operating loss and research tax credit
carryforwards will be accounted for as a credit to stockholders' equity, if and when realized. In determining if and when
excess tax benefits have been realized, we have elected to utilize the with-and-without approach with respect to such excess
tax benefits. We have also elected to ignore the indirect tax effects of stock-based compensation deductions for financial
and accounting reporting purposes, and specifically to recognize the full effect of the research tax credit in income from
operations.
As of January 26, 2014, we had a federal net operating loss carryforward of $601.8 million, combined state net operating
loss carryforwards of $716.0 million, and combined foreign net operating loss carryforwards of $366.9 million. The federal
net operating loss carryforwards will expire beginning in fiscal year 2022 and the state net operating loss carryforwards
will begin to expire in fiscal year 2015 in accordance with the rules of each particular state. The total foreign net operating