NVIDIA 2013 Annual Report Download - page 181
Download and view the complete annual report
Please find page 181 of the 2013 NVIDIA annual report below. You can navigate through the pages in the report by either clicking on the pages listed below, or by using the keyword search tool below to find specific information within the annual report.-
 1
1 -
2
-
3
-
4
-
5
-
6
-
7
-
8
-
9
-
10
-
11
-
12
-
13
-
14
-
15
-
16
-
17
-
18
-
19
-
20
-
21
-
22
-
23
-
24
-
25
-
26
-
27
-
28
-
29
-
30
-
31
-
32
-
33
-
34
-
35
-
36
-
37
-
38
-
39
-
40
-
41
-
42
-
43
-
44
-
45
-
46
-
47
-
48
-
49
-
50
-
51
-
52
-
53
-
54
-
55
-
56
-
57
-
58
-
59
-
60
-
61
-
62
-
63
-
64
-
65
-
66
-
67
-
68
-
69
-
70
-
71
-
72
-
73
-
74
-
75
-
76
-
77
-
78
-
79
-
80
-
81
-
82
-
83
-
84
-
85
-
86
-
87
-
88
-
89
-
90
-
91
-
92
-
93
-
94
-
95
-
96
-
97
-
98
-
99
-
100
-
101
-
102
-
103
-
104
-
105
-
106
-
107
-
108
-
109
-
110
-
111
-
112
-
113
-
114
-
115
-
116
-
117
-
118
-
119
-
120
-
121
-
122
-
123
-
124
-
125
-
126
-
127
-
128
-
129
-
130
-
131
-
132
-
133
-
134
-
135
-
136
-
137
-
138
-
139
-
140
-
141
-
142
-
143
-
144
-
145
-
146
-
147
-
148
-
149
-
150
-
151
-
152
-
153
-
154
-
155
-
156
-
157
-
158
-
159
-
160
-
161
-
162
-
163
-
164
-
165
-
166
-
167
-
168
-
169
-
170
-
 171
171 -
 172
172 -
 173
173 -
 174
174 -
 175
175 -
 176
176 -
 177
177 -
 178
178 -
 179
179 -
 180
180 -
 181
181 -
 182
182 -
 183
183 -
 184
184 -
 185
185 -
 186
186 -
 187
187 -
 188
188 -
 189
189 -
 190
190 -
 191
191 -
192
-
193
-
194
-
195
-
196
-
197
-
198
-
199
-
200
-
201
-
202
-
203
-
204
-
205
-
206
-
207
-
208
-
209
-
210
-
211
-
212
-
213
-
214
-
215
-
216
-
217
-
218
-
219
-
220
-
221
-
222
-
223
-
224
-
225
-
226
-
227
-
228
-
229
-
230
-
231
-
232
-
233
-
234
-
235
-
236
-
237
-
238
-
239
-
240
-
241
-
242
-
243
-
244
-
245
-
246
-
247
-
248
-
249
-
250
-
251
-
252
-
253
-
254
-
255
-
256
-
257
-
258
-
259
-
260
-
261
-
262
-
263
-
264
 |
 |
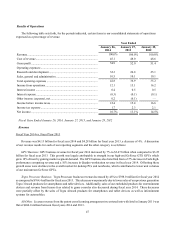
37
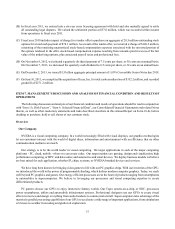
(B) In fiscal year 2011, we entered into a six-year cross licensing agreement with Intel and also mutually agreed to settle
all outstanding legal disputes. We valued the settlement portion at $57.0 million, which was recorded within income
from operations in fiscal year 2011.
(C) Fiscal year 2010 includes impact of charge for a tender offer to purchase an aggregate of 28.5 million outstanding stock
options for a total cash payment of $78.1 million. As a result of the tender offer, we incurred a charge of $140.2 million,
consisting of the remaining unamortized stock-based compensation expenses associated with the unvested portion of
the options tendered in the offer, stock-based compensation expense resulting from amounts paid in excess of the fair
value of the underlying options, plus associated payroll taxes and professional fees.
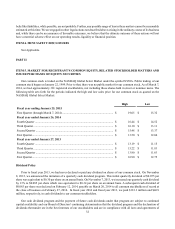
(D) On November 8, 2012, we initiated a quarterly dividend payment of 7.5 cents per share, or 30 cents on an annual basis.
On November 7, 2013, we increased the quarterly cash dividend to 8.5 cents per share, or 34 cents on an annual basis.
(E) On December 2, 2013, we issued $1.5 billion aggregate principal amount of 1.00% Convertible Senior Notes due 2018.
(F) On June 10, 2011, we completed the acquisition of Icera, Inc. for total cash consideration of $352.2 million, and recorded
goodwill of $271.2 million.
ITEM 7. MANAGEMENT’S DISCUSSION AND ANALYSIS OF FINANCIAL CONDITION AND RESULTS OF
OPERATIONS
The following discussion and analysis of our financial condition and results of operations should be read in conjunction
with “Item 1A. Risk Factors”, “Item 6. Selected Financial Data”, our Consolidated Financial Statements and related Notes
thereto, as well as other cautionary statements and risks described elsewhere in this Annual Report on Form 10-K, before
deciding to purchase, hold or sell shares of our common stock.
Overview
Our Company
NVIDIA is a visual computing company. In a world increasingly filled with visual displays, our graphics technologies
let our customers interact with the world of digital ideas, information and entertainment with an efficiency that no other
communication medium can match.
Our strategy is to be the world leader in visual computing. We target applications in each of the major computing
platforms - PC, cloud, mobile - where we can create value. Our target markets are gaming, design and visualization, high
performance computing, or HPC, and data center, and automotive and smart devices. We deploy business models we believe
are best suited for each application, whether IP, chips, systems, or NVIDIA-branded devices and services.
We have long been known for bringing video games to life with our PC graphics chips. With our invention of the GPU,
we introduced the world to the power of programmable shading, which defines modern computer graphics. Today, we reach
well beyond PC graphics and games. Our energy-efficient processors are at the heart of products ranging from smartphones
to automobiles to supercomputers. We believe in leveraging our processors and visual computing expertise to create
differentiated products.
PC gamers choose our GPUs to enjoy immersive fantasy worlds. Our Tegra system-on-a-chip, or SOC, processors
power smartphones, tablets and automobile infotainment systems. Professional designers use our GPUs to create visual
effects in movies and design everything from audio headsets to commercial aircraft. Supercomputers take advantage of the
massively parallel processing capabilities of our GPUs to accelerate a wide range of important applications, from simulations
of viruses to weather forecasting and global oil exploration.