NVIDIA 2013 Annual Report Download - page 228
Download and view the complete annual report
Please find page 228 of the 2013 NVIDIA annual report below. You can navigate through the pages in the report by either clicking on the pages listed below, or by using the keyword search tool below to find specific information within the annual report.-
 1
1 -
2
-
3
-
4
-
5
-
6
-
7
-
8
-
9
-
10
-
11
-
12
-
13
-
14
-
15
-
16
-
17
-
18
-
19
-
20
-
21
-
22
-
23
-
24
-
25
-
26
-
27
-
28
-
29
-
30
-
31
-
32
-
33
-
34
-
35
-
36
-
37
-
38
-
39
-
40
-
41
-
42
-
43
-
44
-
45
-
46
-
47
-
48
-
49
-
50
-
51
-
52
-
53
-
54
-
55
-
56
-
57
-
58
-
59
-
60
-
61
-
62
-
63
-
64
-
65
-
66
-
67
-
68
-
69
-
70
-
71
-
72
-
73
-
74
-
75
-
76
-
77
-
78
-
79
-
80
-
81
-
82
-
83
-
84
-
85
-
86
-
87
-
88
-
89
-
90
-
91
-
92
-
93
-
94
-
95
-
96
-
97
-
98
-
99
-
100
-
101
-
102
-
103
-
104
-
105
-
106
-
107
-
108
-
109
-
110
-
111
-
112
-
113
-
114
-
115
-
116
-
117
-
118
-
119
-
120
-
121
-
122
-
123
-
124
-
125
-
126
-
127
-
128
-
129
-
130
-
131
-
132
-
133
-
134
-
135
-
136
-
137
-
138
-
139
-
140
-
141
-
142
-
143
-
144
-
145
-
146
-
147
-
148
-
149
-
150
-
151
-
152
-
153
-
154
-
155
-
156
-
157
-
158
-
159
-
160
-
161
-
162
-
163
-
164
-
165
-
166
-
167
-
168
-
169
-
170
-
171
-
172
-
173
-
174
-
175
-
176
-
177
-
178
-
179
-
180
-
181
-
182
-
183
-
184
-
185
-
186
-
187
-
188
-
189
-
190
-
191
-
192
-
193
-
194
-
195
-
196
-
197
-
198
-
199
-
200
-
201
-
202
-
203
-
204
-
205
-
206
-
207
-
208
-
209
-
210
-
211
-
212
-
213
-
214
-
215
-
216
-
217
-
 218
218 -
 219
219 -
 220
220 -
 221
221 -
 222
222 -
 223
223 -
 224
224 -
 225
225 -
 226
226 -
 227
227 -
 228
228 -
 229
229 -
 230
230 -
 231
231 -
 232
232 -
 233
233 -
 234
234 -
 235
235 -
 236
236 -
 237
237 -
 238
238 -
239
-
240
-
241
-
242
-
243
-
244
-
245
-
246
-
247
-
248
-
249
-
250
-
251
-
252
-
253
-
254
-
255
-
256
-
257
-
258
-
259
-
260
-
261
-
262
-
263
-
264
 |
 |

NVIDIA CORPORATION AND SUBSIDIARIES
NOTES TO THE CONSOLIDATED FINANCIAL STATEMENTS
(Continued)
84
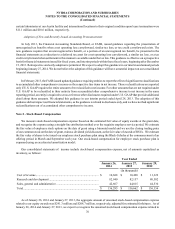
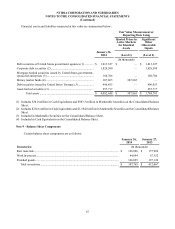
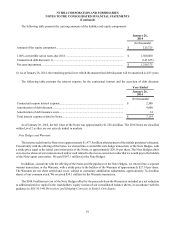
addition of licensed technology, patent portfolios and the acquisition of certain assets from a business combination during
fiscal year 2014. Future amortization expense for the net carrying amount of intangible assets at January 26, 2014 is estimated
to be $79.4 million in fiscal year 2015, $72.7 million in fiscal year 2016, $59.4 million in fiscal year 2017, $48.1 million
in fiscal year 2018, $19.9 million in fiscal year 2019 and $16.5 million in fiscal years subsequent to fiscal year 2019 until
fully amortized.
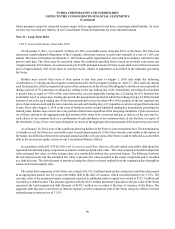
Note 7 - Marketable Securities
All of the cash equivalents and marketable securities are classified as “available-for-sale” securities. Investments in
both fixed and floating rate interest earning instruments carry a degree of interest rate risk. Fixed rate debt securities may
have their market value adversely impacted due to a rise in interest rates, while floating rate securities may produce less
income than expected if interest rates fall. Due in part to these factors, our future investment income may fall short of
expectations due to changes in interest rates or if the decline in fair value of our publicly traded debt or equity investments
is judged to be other-than-temporary. We may suffer losses in principal if we are forced to sell securities that decline in
market value due to changes in interest rates. However, because any debt securities we hold are classified as “available-
for-sale,” no gains or losses are realized in our consolidated statement of income due to changes in interest rates unless such
securities are sold prior to maturity or unless declines in market values are determined to be other-than-temporary. These
securities are reported at fair value with the related unrealized gains and losses included in accumulated other comprehensive
income, a component of stockholders’ equity, net of tax.
The following is a summary of cash equivalents and marketable securities at January 26, 2014 and January 27, 2013:
January 26, 2014
Amortized
Cost Unrealized
Gain Unrealized
Loss Estimated
Fair Value
(In thousands)
Debt securities of United States government agencies ..... $ 1,012,740 $ 848 $ (261) $ 1,013,327
Corporate debt securities................................................... 1,827,788 1,857 (1,065) 1,828,580
Mortgage backed securities issued by United States
government-sponsored enterprises.................................... 185,594 3,837 (725) 188,706
Money market funds ......................................................... 307,865 — — 307,865
Debt securities issued by United States Treasury ............. 495,889 621 (57) 496,453
Asset-backed securities..................................................... 258,017 15 (315) 257,717
Total................................................................................... $ 4,087,893 $ 7,178 $ (2,423) $ 4,092,648
Classified as:
Cash equivalents ............................................................... $ 572,425
Marketable securities ........................................................ 3,520,223
Total................................................................................... $ 4,092,648