NVIDIA 2013 Annual Report Download - page 180
Download and view the complete annual report
Please find page 180 of the 2013 NVIDIA annual report below. You can navigate through the pages in the report by either clicking on the pages listed below, or by using the keyword search tool below to find specific information within the annual report.-
 1
1 -
2
-
3
-
4
-
5
-
6
-
7
-
8
-
9
-
10
-
11
-
12
-
13
-
14
-
15
-
16
-
17
-
18
-
19
-
20
-
21
-
22
-
23
-
24
-
25
-
26
-
27
-
28
-
29
-
30
-
31
-
32
-
33
-
34
-
35
-
36
-
37
-
38
-
39
-
40
-
41
-
42
-
43
-
44
-
45
-
46
-
47
-
48
-
49
-
50
-
51
-
52
-
53
-
54
-
55
-
56
-
57
-
58
-
59
-
60
-
61
-
62
-
63
-
64
-
65
-
66
-
67
-
68
-
69
-
70
-
71
-
72
-
73
-
74
-
75
-
76
-
77
-
78
-
79
-
80
-
81
-
82
-
83
-
84
-
85
-
86
-
87
-
88
-
89
-
90
-
91
-
92
-
93
-
94
-
95
-
96
-
97
-
98
-
99
-
100
-
101
-
102
-
103
-
104
-
105
-
106
-
107
-
108
-
109
-
110
-
111
-
112
-
113
-
114
-
115
-
116
-
117
-
118
-
119
-
120
-
121
-
122
-
123
-
124
-
125
-
126
-
127
-
128
-
129
-
130
-
131
-
132
-
133
-
134
-
135
-
136
-
137
-
138
-
139
-
140
-
141
-
142
-
143
-
144
-
145
-
146
-
147
-
148
-
149
-
150
-
151
-
152
-
153
-
154
-
155
-
156
-
157
-
158
-
159
-
160
-
161
-
162
-
163
-
164
-
165
-
166
-
167
-
168
-
169
-
 170
170 -
 171
171 -
 172
172 -
 173
173 -
 174
174 -
 175
175 -
 176
176 -
 177
177 -
 178
178 -
 179
179 -
 180
180 -
 181
181 -
 182
182 -
 183
183 -
 184
184 -
 185
185 -
 186
186 -
 187
187 -
 188
188 -
 189
189 -
 190
190 -
191
-
192
-
193
-
194
-
195
-
196
-
197
-
198
-
199
-
200
-
201
-
202
-
203
-
204
-
205
-
206
-
207
-
208
-
209
-
210
-
211
-
212
-
213
-
214
-
215
-
216
-
217
-
218
-
219
-
220
-
221
-
222
-
223
-
224
-
225
-
226
-
227
-
228
-
229
-
230
-
231
-
232
-
233
-
234
-
235
-
236
-
237
-
238
-
239
-
240
-
241
-
242
-
243
-
244
-
245
-
246
-
247
-
248
-
249
-
250
-
251
-
252
-
253
-
254
-
255
-
256
-
257
-
258
-
259
-
260
-
261
-
262
-
263
-
264
 |
 |

36
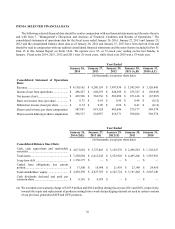
ITEM 6. SELECTED FINANCIAL DATA
The following selected financial data should be read in conjunction with our financial statements and the notes thereto,
and with Item 7, “Management’s Discussion and Analysis of Financial Condition and Results of Operations.” The
consolidated statements of operations data for the fiscal years ended January 26, 2014, January 27, 2013 and January 29,
2012 and the consolidated balance sheet data as of January 26, 2014 and January 27, 2013 have been derived from and
should be read in conjunction with our audited consolidated financial statements and the notes thereto included in Part IV,
Item 15 in this Annual Report on Form 10-K. We operate on a 52- or 53-week year, ending on the last Sunday in
January. Fiscal years 2014, 2013, 2012 and 2011 were 52-week years, while fiscal year 2010 was a 53-week year.
Year Ended
January 26,
2014 January 27,
2013 January 29,
2012 January 30,
2011 (A,B) January 31,
2010 (A,C)
(In thousands, except per share data)
Consolidated Statement of Operations
Data:
Revenue....................................................... $ 4,130,162 $ 4,280,159 $ 3,997,930 $ 3,543,309 $ 3,326,445
Income (loss) from operations..................... $ 496,227 $ 648,239 $ 648,299 $ 255,747 $ (98,945)
Net income (loss)......................................... $ 439,990 $ 562,536 $ 581,090 $ 253,146 $ (67,987)
Basic net income (loss) per share................ $ 0.75 $ 0.91 $ 0.96 $ 0.44 $ (0.12)
Diluted net income (loss) per share............. $ 0.74 $ 0.90 $ 0.94 $ 0.43 $ (0.12)
Shares used in basic per share computation 587,893 619,324 603,646 575,177 549,574
Shares used in diluted per share computation 594,517 624,957 616,371 588,684 549,574
Year Ended
January 26,
2014 (D,E) January 27,
2013 (D) January 29,
2012 (F) January 30,
2011 January 31,
2010
(In thousands, except per share data)
Consolidated Balance Sheet Data:
Cash, cash equivalents and marketable
securities...................................................... $ 4,671,810 $ 3,727,883 $ 3,129,576 $ 2,490,563 $ 1,728,227
Total assets................................................... $ 7,250,894 $ 6,412,245 $ 5,552,928 $ 4,495,246 $ 3,585,918
Long-term debt............................................ $ 1,356,375 $ — $ — $ — $ —
Capital lease obligations, less current
portion.......................................................... $ 17,500 $ 18,998 $ 21,439 $ 23,389 $ 24,450
Total stockholders’ equity............................ $ 4,456,398 $ 4,827,703 $ 4,145,724 $ 3,181,462 $ 2,665,140
Cash dividends declared and paid per
common share.............................................. $ 0.310 $ 0.075 $ — $ — $ —
(A) We recorded a net warranty charge of $193.9 million and $94.0 million during fiscal years 2011 and 2010, respectively,
towards the repair and replacement of products arising from a weak die/packaging material set used in certain versions
of our previous generation MCP and GPU products.