NVIDIA 2013 Annual Report Download - page 46
Download and view the complete annual report
Please find page 46 of the 2013 NVIDIA annual report below. You can navigate through the pages in the report by either clicking on the pages listed below, or by using the keyword search tool below to find specific information within the annual report.-
 1
1 -
2
-
3
-
4
-
5
-
6
-
7
-
8
-
9
-
10
-
11
-
12
-
13
-
14
-
15
-
16
-
17
-
18
-
19
-
20
-
21
-
22
-
23
-
24
-
25
-
26
-
27
-
28
-
29
-
30
-
31
-
32
-
33
-
34
-
35
-
 36
36 -
 37
37 -
 38
38 -
 39
39 -
 40
40 -
 41
41 -
 42
42 -
 43
43 -
 44
44 -
 45
45 -
 46
46 -
 47
47 -
 48
48 -
 49
49 -
 50
50 -
 51
51 -
 52
52 -
 53
53 -
 54
54 -
 55
55 -
 56
56 -
57
-
58
-
59
-
60
-
61
-
62
-
63
-
64
-
65
-
66
-
67
-
68
-
69
-
70
-
71
-
72
-
73
-
74
-
75
-
76
-
77
-
78
-
79
-
80
-
81
-
82
-
83
-
84
-
85
-
86
-
87
-
88
-
89
-
90
-
91
-
92
-
93
-
94
-
95
-
96
-
97
-
98
-
99
-
100
-
101
-
102
-
103
-
104
-
105
-
106
-
107
-
108
-
109
-
110
-
111
-
112
-
113
-
114
-
115
-
116
-
117
-
118
-
119
-
120
-
121
-
122
-
123
-
124
-
125
-
126
-
127
-
128
-
129
-
130
-
131
-
132
-
133
-
134
-
135
-
136
-
137
-
138
-
139
-
140
-
141
-
142
-
143
-
144
-
145
-
146
-
147
-
148
-
149
-
150
-
151
-
152
-
153
-
154
-
155
-
156
-
157
-
158
-
159
-
160
-
161
-
162
-
163
-
164
-
165
-
166
-
167
-
168
-
169
-
170
-
171
-
172
-
173
-
174
-
175
-
176
-
177
-
178
-
179
-
180
-
181
-
182
-
183
-
184
-
185
-
186
-
187
-
188
-
189
-
190
-
191
-
192
-
193
-
194
-
195
-
196
-
197
-
198
-
199
-
200
-
201
-
202
-
203
-
204
-
205
-
206
-
207
-
208
-
209
-
210
-
211
-
212
-
213
-
214
-
215
-
216
-
217
-
218
-
219
-
220
-
221
-
222
-
223
-
224
-
225
-
226
-
227
-
228
-
229
-
230
-
231
-
232
-
233
-
234
-
235
-
236
-
237
-
238
-
239
-
240
-
241
-
242
-
243
-
244
-
245
-
246
-
247
-
248
-
249
-
250
-
251
-
252
-
253
-
254
-
255
-
256
-
257
-
258
-
259
-
260
-
261
-
262
-
263
-
264
 |
 |

28
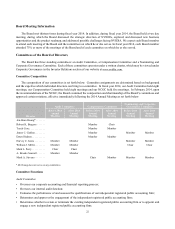
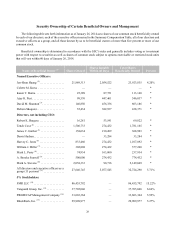
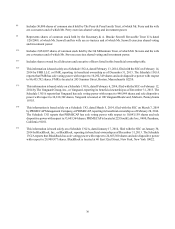
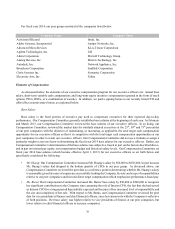
Security Ownership of Certain Beneficial Owners and Management
The following table sets forth information as of January 26, 2014 as to shares of our common stock beneficially owned
by each of our directors, each of the executive officers named in the Summary Compensation Table, all of our directors and
executive officers as a group, and all those known by us to be beneficial owners of more than five percent or more of our
common stock.
Beneficial ownership is determined in accordance with the SEC’s rules and generally includes voting or investment
power with respect to securities as well as shares of common stock subject to options exercisable or restricted stock units
that will vest within 60 days of January 26, 2014.
Name of Beneficial Owner (1) Shares Owned
Shares Issuable
Within 60 Days
Total Shares
Beneficially Owned Percent
Named Executive Officers:
Jen-Hsun Huang (2). . . . . . . . . . . . . . . . . 21,869,313 2,054,522 23,923,835 4.20%
Colette M. Kress . . . . . . . . . . . . . . . . . . — — —*
Karen T. Burns. . . . . . . . . . . . . . . . . . . . 25,389 87,751 113,140 *
Ajay K. Puri . . . . . . . . . . . . . . . . . . . . . . 98,576 447,461 546,037 *
David M. Shannon (3) . . . . . . . . . . . . . . . 146,850 456,336 603,186 *
Debora Shoquist. . . . . . . . . . . . . . . . . . . 55,434 382,937 438,371 *
Directors, not including CEO:
Robert K. Burgess . . . . . . . . . . . . . . . . . 16,281 53,541 69,822 *
Tench Coxe (4) . . . . . . . . . . . . . . . . . . . . 1,506,733 274,432 1,781,165 *
James C. Gaither (5) . . . . . . . . . . . . . . . . 158,634 210,269 368,903 *
Dawn Hudson. . . . . . . . . . . . . . . . . . . . . — 33,284 33,284 *
Harvey C. Jones (6) . . . . . . . . . . . . . . . . . 833,460 274,432 1,107,892 *
William J. Miller (7) . . . . . . . . . . . . . . . . 302,808 274,432 577,240 *
Mark L. Perry (8). . . . . . . . . . . . . . . . . . . 74,934 163,000 237,934 *
A. Brooke Seawell (9) . . . . . . . . . . . . . . . 500,000 274,432 774,432 *
Mark A. Stevens (10) . . . . . . . . . . . . . . . . 2,058,333 90,716 2,149,049 *
All directors and executive officers as a
group (13 persons) (11) . . . . . . . . . . . . . . 27,646,745 5,077,545 32,724,290 5.71%
5% Stockholders:
FMR LLC (12) . . . . . . . . . . . . . . . . . . . . . 86,455,792 — 86,455,792 15.22%
Vanguard Group, Inc. (13) . . . . . . . . . . . . 37,705,046 — 37,705,046 6.64%
PRIMECAP Management Company (14) 33,603,364 — 33,603,364 5.92%
BlackRock, Inc. (15) . . . . . . . . . . . . . . . . 29,909,977 — 29,909,977 5.27%