NVIDIA 2013 Annual Report Download - page 179
Download and view the complete annual report
Please find page 179 of the 2013 NVIDIA annual report below. You can navigate through the pages in the report by either clicking on the pages listed below, or by using the keyword search tool below to find specific information within the annual report.-
 1
1 -
2
-
3
-
4
-
5
-
6
-
7
-
8
-
9
-
10
-
11
-
12
-
13
-
14
-
15
-
16
-
17
-
18
-
19
-
20
-
21
-
22
-
23
-
24
-
25
-
26
-
27
-
28
-
29
-
30
-
31
-
32
-
33
-
34
-
35
-
36
-
37
-
38
-
39
-
40
-
41
-
42
-
43
-
44
-
45
-
46
-
47
-
48
-
49
-
50
-
51
-
52
-
53
-
54
-
55
-
56
-
57
-
58
-
59
-
60
-
61
-
62
-
63
-
64
-
65
-
66
-
67
-
68
-
69
-
70
-
71
-
72
-
73
-
74
-
75
-
76
-
77
-
78
-
79
-
80
-
81
-
82
-
83
-
84
-
85
-
86
-
87
-
88
-
89
-
90
-
91
-
92
-
93
-
94
-
95
-
96
-
97
-
98
-
99
-
100
-
101
-
102
-
103
-
104
-
105
-
106
-
107
-
108
-
109
-
110
-
111
-
112
-
113
-
114
-
115
-
116
-
117
-
118
-
119
-
120
-
121
-
122
-
123
-
124
-
125
-
126
-
127
-
128
-
129
-
130
-
131
-
132
-
133
-
134
-
135
-
136
-
137
-
138
-
139
-
140
-
141
-
142
-
143
-
144
-
145
-
146
-
147
-
148
-
149
-
150
-
151
-
152
-
153
-
154
-
155
-
156
-
157
-
158
-
159
-
160
-
161
-
162
-
163
-
164
-
165
-
166
-
167
-
168
-
 169
169 -
 170
170 -
 171
171 -
 172
172 -
 173
173 -
 174
174 -
 175
175 -
 176
176 -
 177
177 -
 178
178 -
 179
179 -
 180
180 -
 181
181 -
 182
182 -
 183
183 -
 184
184 -
 185
185 -
 186
186 -
 187
187 -
 188
188 -
 189
189 -
190
-
191
-
192
-
193
-
194
-
195
-
196
-
197
-
198
-
199
-
200
-
201
-
202
-
203
-
204
-
205
-
206
-
207
-
208
-
209
-
210
-
211
-
212
-
213
-
214
-
215
-
216
-
217
-
218
-
219
-
220
-
221
-
222
-
223
-
224
-
225
-
226
-
227
-
228
-
229
-
230
-
231
-
232
-
233
-
234
-
235
-
236
-
237
-
238
-
239
-
240
-
241
-
242
-
243
-
244
-
245
-
246
-
247
-
248
-
249
-
250
-
251
-
252
-
253
-
254
-
255
-
256
-
257
-
258
-
259
-
260
-
261
-
262
-
263
-
264
 |
 |
35
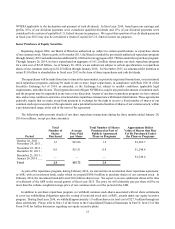
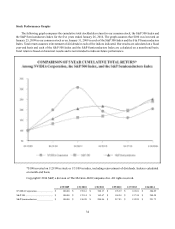
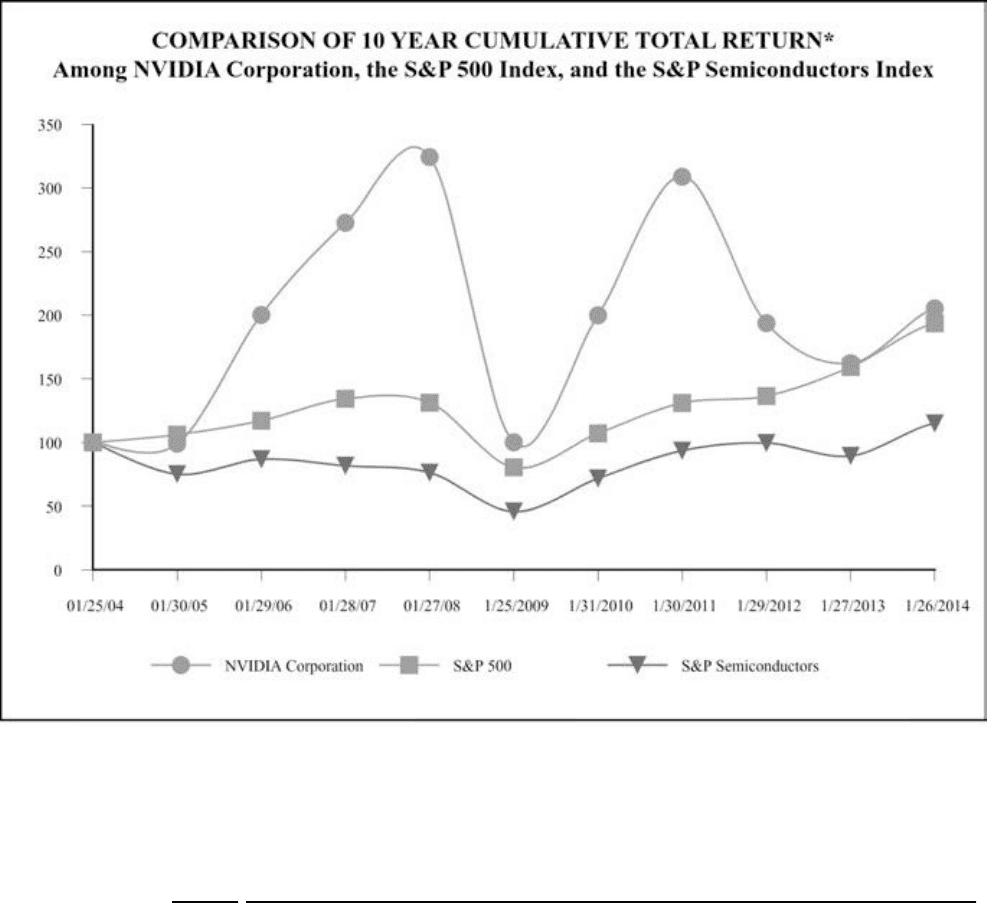
The following graph compares the cumulative total stockholder return for our common stock, the S&P 500 Index and
the S&P Semiconductors Index for the ten years ended January 26, 2014. The graph assumes that $100 was invested on
January 25, 2004 in our common stock or on January 31, 2004 in each of the S&P 500 Index and the S&P Semiconductors
Index. Total return assumes reinvestment of dividends in each of the indices indicated. Our results are calculated on a fiscal
year-end basis and each of the S&P 500 Index and the S&P Semiconductors Index are calculated on a month-end basis.
Total return is based on historical results and is not intended to indicate future performance.
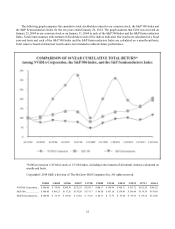
*$100 invested on 1/25/04 in stock or 1/31/04 index, including reinvestment of dividends. Indexes calculated on
month-end basis.
Copyright© 2014 S&P, a division of The McGraw-Hill Companies Inc. All rights reserved.
1/25/04 1/30/05 1/29/06 1/28/07 1/27/08 1/25/09 1/31/10 1/30/11 1/29/12 1/27/13 1/26/14
NVIDIA Corporation... $100.00 $ 99.09 $200.30 $272.59 $ 324.17 $100.17 $ 199.96 $ 308.71 $ 193.72 $ 162.29 $ 205.25
S&P 500....................... $ 100.00 $ 106.23 $ 117.26 $ 134.28 $ 131.17 $ 80.50 $107.18 $ 130.96 $ 136.48 $ 159.38 $193.68
S&P Semiconductors ... $100.00 $ 75.16 $ 86.90 $ 81.82 $ 76.25 $ 45.71 $ 71.75 $ 93.64 $ 99.56 $ 89.54 $115.06