NVIDIA 2013 Annual Report Download - page 211
Download and view the complete annual report
Please find page 211 of the 2013 NVIDIA annual report below. You can navigate through the pages in the report by either clicking on the pages listed below, or by using the keyword search tool below to find specific information within the annual report.-
 1
1 -
2
-
3
-
4
-
5
-
6
-
7
-
8
-
9
-
10
-
11
-
12
-
13
-
14
-
15
-
16
-
17
-
18
-
19
-
20
-
21
-
22
-
23
-
24
-
25
-
26
-
27
-
28
-
29
-
30
-
31
-
32
-
33
-
34
-
35
-
36
-
37
-
38
-
39
-
40
-
41
-
42
-
43
-
44
-
45
-
46
-
47
-
48
-
49
-
50
-
51
-
52
-
53
-
54
-
55
-
56
-
57
-
58
-
59
-
60
-
61
-
62
-
63
-
64
-
65
-
66
-
67
-
68
-
69
-
70
-
71
-
72
-
73
-
74
-
75
-
76
-
77
-
78
-
79
-
80
-
81
-
82
-
83
-
84
-
85
-
86
-
87
-
88
-
89
-
90
-
91
-
92
-
93
-
94
-
95
-
96
-
97
-
98
-
99
-
100
-
101
-
102
-
103
-
104
-
105
-
106
-
107
-
108
-
109
-
110
-
111
-
112
-
113
-
114
-
115
-
116
-
117
-
118
-
119
-
120
-
121
-
122
-
123
-
124
-
125
-
126
-
127
-
128
-
129
-
130
-
131
-
132
-
133
-
134
-
135
-
136
-
137
-
138
-
139
-
140
-
141
-
142
-
143
-
144
-
145
-
146
-
147
-
148
-
149
-
150
-
151
-
152
-
153
-
154
-
155
-
156
-
157
-
158
-
159
-
160
-
161
-
162
-
163
-
164
-
165
-
166
-
167
-
168
-
169
-
170
-
171
-
172
-
173
-
174
-
175
-
176
-
177
-
178
-
179
-
180
-
181
-
182
-
183
-
184
-
185
-
186
-
187
-
188
-
189
-
190
-
191
-
192
-
193
-
194
-
195
-
196
-
197
-
198
-
199
-
200
-
 201
201 -
 202
202 -
 203
203 -
 204
204 -
 205
205 -
 206
206 -
 207
207 -
 208
208 -
 209
209 -
 210
210 -
 211
211 -
 212
212 -
 213
213 -
 214
214 -
 215
215 -
 216
216 -
 217
217 -
 218
218 -
 219
219 -
 220
220 -
 221
221 -
222
-
223
-
224
-
225
-
226
-
227
-
228
-
229
-
230
-
231
-
232
-
233
-
234
-
235
-
236
-
237
-
238
-
239
-
240
-
241
-
242
-
243
-
244
-
245
-
246
-
247
-
248
-
249
-
250
-
251
-
252
-
253
-
254
-
255
-
256
-
257
-
258
-
259
-
260
-
261
-
262
-
263
-
264
 |
 |

67
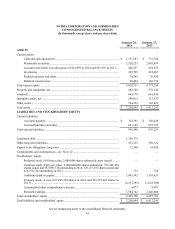
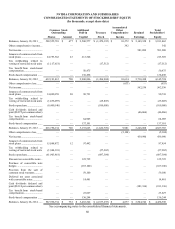
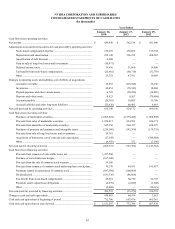
NVIDIA CORPORATION AND SUBSIDIARIES
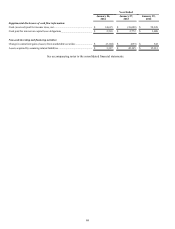
CONSOLIDATED STATEMENTS OF CASH FLOWS
(In thousands)
Year Ended
January 26,
2014 January 27,
2013 January 29,
2012
Cash flows from operating activities:
Net income ........................................................................................................... $ 439,990 $ 562,536 $ 581,090
Adjustments to reconcile net income to net cash provided by operating activities:
Stock-based compensation expense .......................................................... 136,295 136,662 136,354
Depreciation and amortization .................................................................. 239,148 226,235 204,205
Amortization of debt discount................................................................... 4,600 — —
Gain on sale of long-lived assets and investments.................................... (10,471) — —
Deferred income taxes............................................................................... 15,430 31,860 19,056
Tax benefit from stock-based compensation............................................. (25,801) (68,710) (52,793)
Other.......................................................................................................... 23,718 47,911 19,095
Changes in operating assets and liabilities, net of effects of acquisitions:
Accounts receivable................................................................................... 28,852 (118,940) 26,236
Inventories................................................................................................. 24,651 (78,949) 18,884
Prepaid expenses and other current assets................................................. 6,729 (20,290) (14,803)
Deposits and other assets........................................................................... 4,823 8,567 (70,694)
Accounts payable....................................................................................... (20,382) 10,885 35,708
Accrued liabilities and other long-term liabilities..................................... (32,436) 86,405 6,818
Net cash provided by operating activities............................................................ 835,146 824,172 909,156
Cash flows from investing activities:
Purchases of marketable securities............................................................ (3,065,404) (2,378,445) (1,964,898)
Proceeds from sales of marketable securities............................................ 1,926,817 854,993 656,171
Proceeds from maturities of marketable securities.................................... 585,150 962,417 654,572
Purchases of property and equipment and intangible assets ..................... (255,186) (183,309) (138,735)
Proceeds from sale of long-lived assets and investments.......................... 24,781 — —
Acquisition of businesses, net of cash and cash equivalents..................... (17,145) — (348,884)
Other.......................................................................................................... (4,950) 352 (1,590)
Net cash used in investing activities .................................................................... (805,937) (743,992) (1,143,364)
Cash flows from financing activities:
Proceeds from issuance of convertible notes, net...................................... 1,477,500 — —
Purchase of convertible note hedges ......................................................... (167,100) — —
Proceeds from the sale of common stock warrants ................................... 59,100 — —
Proceeds from issuance of common stock under employee stock plans... 70,170 64,935 195,857
Payments related to repurchases of common stock................................... (887,304) (100,000) —
Dividends paid........................................................................................... (181,336) (46,866) —
Tax benefit from stock-based compensation............................................. 25,801 68,710 52,793
Payments under capital lease obligations.................................................. (2,239) (2,049) (1,608)
Other.......................................................................................................... (5,000) — (10,319)
Net cash (used in) provided by financing activities............................................. 389,592 (15,270) 236,723
Change in cash and cash equivalents ................................................................... 418,801 64,910 2,515
Cash and cash equivalents at beginning of period ............................................... 732,786 667,876 665,361
Cash and cash equivalents at end of period ......................................................... $ 1,151,587 $ 732,786 $ 667,876