NVIDIA 2013 Annual Report Download - page 56
Download and view the complete annual report
Please find page 56 of the 2013 NVIDIA annual report below. You can navigate through the pages in the report by either clicking on the pages listed below, or by using the keyword search tool below to find specific information within the annual report.-
 1
1 -
2
-
3
-
4
-
5
-
6
-
7
-
8
-
9
-
10
-
11
-
12
-
13
-
14
-
15
-
16
-
17
-
18
-
19
-
20
-
21
-
22
-
23
-
24
-
25
-
26
-
27
-
28
-
29
-
30
-
31
-
32
-
33
-
34
-
35
-
36
-
37
-
38
-
39
-
40
-
41
-
42
-
43
-
44
-
45
-
 46
46 -
 47
47 -
 48
48 -
 49
49 -
 50
50 -
 51
51 -
 52
52 -
 53
53 -
 54
54 -
 55
55 -
 56
56 -
 57
57 -
 58
58 -
 59
59 -
 60
60 -
 61
61 -
 62
62 -
 63
63 -
 64
64 -
 65
65 -
 66
66 -
67
-
68
-
69
-
70
-
71
-
72
-
73
-
74
-
75
-
76
-
77
-
78
-
79
-
80
-
81
-
82
-
83
-
84
-
85
-
86
-
87
-
88
-
89
-
90
-
91
-
92
-
93
-
94
-
95
-
96
-
97
-
98
-
99
-
100
-
101
-
102
-
103
-
104
-
105
-
106
-
107
-
108
-
109
-
110
-
111
-
112
-
113
-
114
-
115
-
116
-
117
-
118
-
119
-
120
-
121
-
122
-
123
-
124
-
125
-
126
-
127
-
128
-
129
-
130
-
131
-
132
-
133
-
134
-
135
-
136
-
137
-
138
-
139
-
140
-
141
-
142
-
143
-
144
-
145
-
146
-
147
-
148
-
149
-
150
-
151
-
152
-
153
-
154
-
155
-
156
-
157
-
158
-
159
-
160
-
161
-
162
-
163
-
164
-
165
-
166
-
167
-
168
-
169
-
170
-
171
-
172
-
173
-
174
-
175
-
176
-
177
-
178
-
179
-
180
-
181
-
182
-
183
-
184
-
185
-
186
-
187
-
188
-
189
-
190
-
191
-
192
-
193
-
194
-
195
-
196
-
197
-
198
-
199
-
200
-
201
-
202
-
203
-
204
-
205
-
206
-
207
-
208
-
209
-
210
-
211
-
212
-
213
-
214
-
215
-
216
-
217
-
218
-
219
-
220
-
221
-
222
-
223
-
224
-
225
-
226
-
227
-
228
-
229
-
230
-
231
-
232
-
233
-
234
-
235
-
236
-
237
-
238
-
239
-
240
-
241
-
242
-
243
-
244
-
245
-
246
-
247
-
248
-
249
-
250
-
251
-
252
-
253
-
254
-
255
-
256
-
257
-
258
-
259
-
260
-
261
-
262
-
263
-
264
 |
 |

38
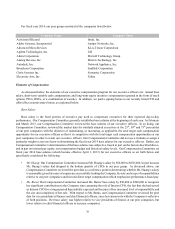
For fiscal year 2014, our peer group consisted of the companies listed below.
Company Name Company Name
Activision Blizzard Intuit, Inc.
Adobe Systems, Incorporated Juniper Networks, Inc.
Advanced Micro Devices KLA-Tencor Corporation
Agilent Technologies, Inc. LSI
Altera Corporation Marvell Technology Group
Analog Devices, Inc. Micron Technology, Inc.
Autodesk, Inc. Network Appliance, Inc.
Broadcom Corporation SanDisk Corporation
Citrix Systems Inc. Symantec Corporation
Electronic Arts, Inc. Xilinx
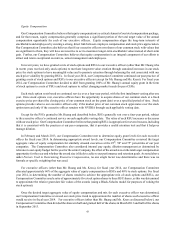
Elements of Compensation
As discussed below, the elements of our executive compensation program for our executive officers are: annual base
salary; short-term variable cash compensation; and long-term equity incentive compensation (granted in the form of stock
options, PSUs, RSUs, or a combination of awards). In addition, we paid a signing bonus to our recently hired CFO and
offered her an anniversary bonus, as explained below.
Base Salary
Base salary is the fixed portion of executive pay used to compensate executives for their expected day-to-day
performance. Our Compensation Committee generally establishes base salaries at the beginning of each year. In February
and March 2013, our Compensation Committee reviewed the base salaries of our executive officers. In so doing, our
Compensation Committee reviewed the market data for similarly situated executives at the 25th, 50th and 75th percentiles
of our peer companies with the objective of maintaining, or increasing, as applicable, the total target cash compensation
opportunity for our executive officers so that it is competitive with the total target cash compensation opportunities at our
peer companies in order to retain our executive officers. Our Compensation Committee did not use a formula or assign a
particular weight to any one factor in determining the fiscal year 2014 base salaries for our executive officers. Rather, our
Compensation Committee’s determination of the base salaries was subjective, based in part on the factors described above,
and in part on internal pay equity, our compensation budget and historical salary levels. Our Compensation Committee set
fiscal year 2014 base salaries (which became effective April 1, 2013) for our executive officers as set forth below and
specifically considered the following:
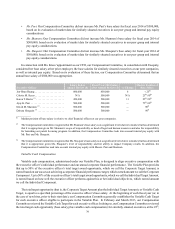
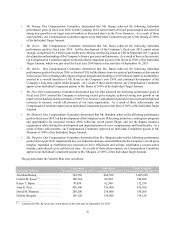
• Mr. Huang: Our Compensation Committee increased Mr. Huang’s salary by $50,000 to $850,000, in part because
Mr. Huang’s salary had dropped to the bottom quartile of CEOs in our peer group. As discussed above, our
Compensation Committee reviewed the peer data as a reference point in determining whether Mr. Huang’s salary
is reasonable given his years of experience successfully leading the Company, his role and scope of responsibilities
relative to our peer companies and his total direct target compensation which emphasizes performance-based pay.
• Ms. Burns: Our Compensation Committee increased Ms. Burns’ base salary by $50,000 to $500,000 to recognize
her significant contributions to the Company since assuming the role of Interim CFO, the fact that she had served
as Interim CFO for a longer period than initially expected and because of her increased level of responsibility and
the size and complexity of her role. With respect to Ms. Burns, our Compensation Committee reviewed the peer
data for vice presidents of finance and chief financial officers, since her current role with the Company is reflective
of both positions. Her base salary was higher relative to vice presidents of finance at our peer companies, but
lower relative to chief financial officers at our peer companies.