NVIDIA 2013 Annual Report Download - page 62
Download and view the complete annual report
Please find page 62 of the 2013 NVIDIA annual report below. You can navigate through the pages in the report by either clicking on the pages listed below, or by using the keyword search tool below to find specific information within the annual report.-
 1
1 -
2
-
3
-
4
-
5
-
6
-
7
-
8
-
9
-
10
-
11
-
12
-
13
-
14
-
15
-
16
-
17
-
18
-
19
-
20
-
21
-
22
-
23
-
24
-
25
-
26
-
27
-
28
-
29
-
30
-
31
-
32
-
33
-
34
-
35
-
36
-
37
-
38
-
39
-
40
-
41
-
42
-
43
-
44
-
45
-
46
-
47
-
48
-
49
-
50
-
51
-
 52
52 -
 53
53 -
 54
54 -
 55
55 -
 56
56 -
 57
57 -
 58
58 -
 59
59 -
 60
60 -
 61
61 -
 62
62 -
 63
63 -
 64
64 -
 65
65 -
 66
66 -
 67
67 -
 68
68 -
 69
69 -
 70
70 -
 71
71 -
 72
72 -
73
-
74
-
75
-
76
-
77
-
78
-
79
-
80
-
81
-
82
-
83
-
84
-
85
-
86
-
87
-
88
-
89
-
90
-
91
-
92
-
93
-
94
-
95
-
96
-
97
-
98
-
99
-
100
-
101
-
102
-
103
-
104
-
105
-
106
-
107
-
108
-
109
-
110
-
111
-
112
-
113
-
114
-
115
-
116
-
117
-
118
-
119
-
120
-
121
-
122
-
123
-
124
-
125
-
126
-
127
-
128
-
129
-
130
-
131
-
132
-
133
-
134
-
135
-
136
-
137
-
138
-
139
-
140
-
141
-
142
-
143
-
144
-
145
-
146
-
147
-
148
-
149
-
150
-
151
-
152
-
153
-
154
-
155
-
156
-
157
-
158
-
159
-
160
-
161
-
162
-
163
-
164
-
165
-
166
-
167
-
168
-
169
-
170
-
171
-
172
-
173
-
174
-
175
-
176
-
177
-
178
-
179
-
180
-
181
-
182
-
183
-
184
-
185
-
186
-
187
-
188
-
189
-
190
-
191
-
192
-
193
-
194
-
195
-
196
-
197
-
198
-
199
-
200
-
201
-
202
-
203
-
204
-
205
-
206
-
207
-
208
-
209
-
210
-
211
-
212
-
213
-
214
-
215
-
216
-
217
-
218
-
219
-
220
-
221
-
222
-
223
-
224
-
225
-
226
-
227
-
228
-
229
-
230
-
231
-
232
-
233
-
234
-
235
-
236
-
237
-
238
-
239
-
240
-
241
-
242
-
243
-
244
-
245
-
246
-
247
-
248
-
249
-
250
-
251
-
252
-
253
-
254
-
255
-
256
-
257
-
258
-
259
-
260
-
261
-
262
-
263
-
264
 |
 |

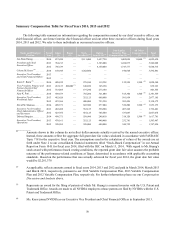
44
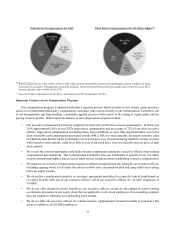
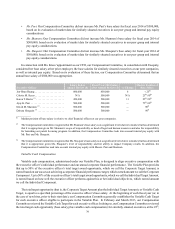
Mr. Huang was granted a mix of PSUs and stock options. Mr. Huang was granted an option to purchase 475,000 shares
of common stock, of which 50% were granted in March 2013 and 50% were granted in September 2013. In addition, in
March 2013, Mr. Huang was granted a PSU, under which he was eligible to vest in up to 300,000 RSUs, based on the
Company’s attainment of Adjusted Non-GAAP Operating Income as described below. The Compensation Committee
selected Adjusted Non-GAAP Operating Income as the financial performance metric for Mr. Huang’s PSUs as the
Compensation Committee believes this to be a key indicator of our overall financial performance. The Compensation
Committee also believes it should tie our executive compensation programs to our key financial metrics in the short-term
which it believes drives value and contributes to the long-term success of the Company. In addition, given that fiscal year
2014 was the first year that the Company granted PSUs, the Compensation Committee decided to simplify administration
and selected annual Adjusted Non-GAAP Operating Income as the performance metric, consistent with the annual Variable
Plan. However, unlike the Threshold goal established for the Variable Plan, the Compensation Committee established a
minimum performance requirement of Target before any of the PSUs would be earned; the Compensation Committee also
capped the Maximum award at 167% of Target.
Fiscal Year 2014 Adjusted Non-GAAP
Operating Income Number of PSUs Eligible to Vest
Threshold. . . . . . . . . . . . . . . . . . . . . . . . Less than $635 million 0
Target. . . . . . . . . . . . . . . . . . . . . . . . . . . $635 million 180,000
Maximum . . . . . . . . . . . . . . . . . . . . . . . $900 million or more 300,000
For PSUs earned based on the performance achieved, 25% of the shares subject to such PSUs would vest and be issued
on March 19, 2014, with the remaining 12.5% of such shares vesting approximately every six months thereafter (subject
to his continued service with the Company on each applicable vesting date). For purposes of the PSUs, the Compensation
Committee certified on February 11, 2014 that the Company achieved Adjusted Non-GAAP Operating Income in fiscal
year 2014 of $667 million, reflecting aggregate adjustments to GAAP operating income of $171 million, reflecting an
additional $3 million in legal costs from non-GAAP operating income that we reported in our earnings release materials
for fiscal year 2014, as discussed above. This resulted in 108.05% of Mr. Huang’s Target PSUs (or 194,491 shares) becoming
eligible to vest over a four year period beginning on the date of grant (with 25% vesting on March 19, 2014). The remaining
portion of his PSU (105,509 shares) terminated on February 11, 2014.
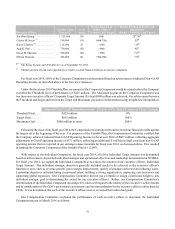
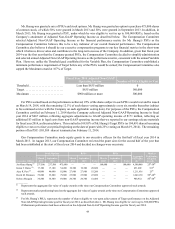
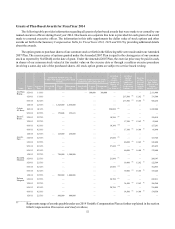
Our Compensation Committee made equity grants to our executive officers for the first half of fiscal year 2014 in
March 2013. In August 2013, our Compensation Committee reviewed the grant sizes for the second half of the year that
had been established at the start of fiscal year 2014 and decided no changes were necessary.
Executive Officer
Stock Options RSUs PSUs
Aggregate
Fair Value
($) (1)
Market
Positioning
of Equity
Awards (2)
March
2013
September
2013 Total
March
2013
September
2013 Total
March
2013
September
2013 Total
Jen-Hsun Huang (3) 237,500 237,500 475,000 — — — 180,000 — 180,000 4,500,000 25th-50th
Karen T. Burns (4). . 17,100 17,100 34,200 10,300 10,300 20,600 — — — 451,609 <10th
Ajay K. Puri (5). . . . 46,000 46,000 92,000 27,600 27,600 55,200 — — — 1,211,936 25th
David M. Shannon. 39,800 39,800 79,600 23,900 23,900 47,800 — — — 1,049,130 50th-60th
Debora Shoquist . . 34,500 34,500 69,000 20,700 20,700 41,400 — — — 908,952 50th-60th
__________
(1) Represents the aggregate fair value of equity awards at the time our Compensation Committee approved such awards.
(2) Represents market positioning based on the aggregate fair value of equity awards at the time our Compensation Committee approved
such awards.
(3) For Mr. Huang’s PSUs, represents the number of shares eligible to vest upon achievement of Target performance on the Adjusted
Non-GAAP Operating Income goal for fiscal year 2014, as described above. Mr. Huang was eligible to vest in up to 300,000 PSUs
if Maximum performance had been achieved on the Adjusted Non-GAAP Operating Income goal for fiscal year 2014.