NVIDIA 2013 Annual Report Download - page 221
Download and view the complete annual report
Please find page 221 of the 2013 NVIDIA annual report below. You can navigate through the pages in the report by either clicking on the pages listed below, or by using the keyword search tool below to find specific information within the annual report.-
 1
1 -
2
-
3
-
4
-
5
-
6
-
7
-
8
-
9
-
10
-
11
-
12
-
13
-
14
-
15
-
16
-
17
-
18
-
19
-
20
-
21
-
22
-
23
-
24
-
25
-
26
-
27
-
28
-
29
-
30
-
31
-
32
-
33
-
34
-
35
-
36
-
37
-
38
-
39
-
40
-
41
-
42
-
43
-
44
-
45
-
46
-
47
-
48
-
49
-
50
-
51
-
52
-
53
-
54
-
55
-
56
-
57
-
58
-
59
-
60
-
61
-
62
-
63
-
64
-
65
-
66
-
67
-
68
-
69
-
70
-
71
-
72
-
73
-
74
-
75
-
76
-
77
-
78
-
79
-
80
-
81
-
82
-
83
-
84
-
85
-
86
-
87
-
88
-
89
-
90
-
91
-
92
-
93
-
94
-
95
-
96
-
97
-
98
-
99
-
100
-
101
-
102
-
103
-
104
-
105
-
106
-
107
-
108
-
109
-
110
-
111
-
112
-
113
-
114
-
115
-
116
-
117
-
118
-
119
-
120
-
121
-
122
-
123
-
124
-
125
-
126
-
127
-
128
-
129
-
130
-
131
-
132
-
133
-
134
-
135
-
136
-
137
-
138
-
139
-
140
-
141
-
142
-
143
-
144
-
145
-
146
-
147
-
148
-
149
-
150
-
151
-
152
-
153
-
154
-
155
-
156
-
157
-
158
-
159
-
160
-
161
-
162
-
163
-
164
-
165
-
166
-
167
-
168
-
169
-
170
-
171
-
172
-
173
-
174
-
175
-
176
-
177
-
178
-
179
-
180
-
181
-
182
-
183
-
184
-
185
-
186
-
187
-
188
-
189
-
190
-
191
-
192
-
193
-
194
-
195
-
196
-
197
-
198
-
199
-
200
-
201
-
202
-
203
-
204
-
205
-
206
-
207
-
208
-
209
-
210
-
 211
211 -
 212
212 -
 213
213 -
 214
214 -
 215
215 -
 216
216 -
 217
217 -
 218
218 -
 219
219 -
 220
220 -
 221
221 -
 222
222 -
 223
223 -
 224
224 -
 225
225 -
 226
226 -
 227
227 -
 228
228 -
 229
229 -
 230
230 -
 231
231 -
232
-
233
-
234
-
235
-
236
-
237
-
238
-
239
-
240
-
241
-
242
-
243
-
244
-
245
-
246
-
247
-
248
-
249
-
250
-
251
-
252
-
253
-
254
-
255
-
256
-
257
-
258
-
259
-
260
-
261
-
262
-
263
-
264
 |
 |
NVIDIA CORPORATION AND SUBSIDIARIES
NOTES TO THE CONSOLIDATED FINANCIAL STATEMENTS
(Continued)
77
stock options over an estimated weighted average amortization period of 2.5 years and 2.7 years, respectively. As of both
January 26, 2014 and January 27, 2013, we expect to recognize the unearned stock-based compensation expense related to
RSUs over an estimated weighted average amortization period of 2.7 years.
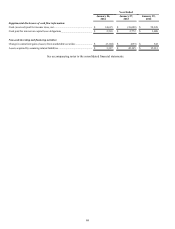
Stock-based compensation capitalized in inventories resulted in a net charge of $0.1 million, $0.4 million and $0.1
million in cost of revenue during the fiscal years ended January 26, 2014, January 27, 2013 and January 29, 2012,
respectively.
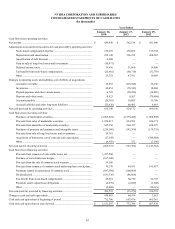
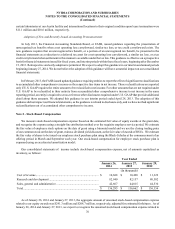
During fiscal years 2014, 2013 and 2012, we granted approximately 6.1 million, 7.1 million and 6.4 million stock
options, respectively, with estimated total grant-date fair values of $21.3 million, $38.3 million and $52.4 million,
respectively, and weighted average grant-date fair values of $3.47, $5.38 and $8.16 per option, respectively. During fiscal
years 2014, 2013 and 2012, we granted approximately 10.8 million, 8.1 million and 7.3 million RSUs, respectively, with
estimated total grant-date fair values of $144.8 million, $112.8 million and $119.7 million, respectively, and weighted
average grant-date fair values of $13.46, $13.86 and $16.31 per RSU, respectively.
Of the estimated total grant-date fair value, we estimated that the stock-based compensation expense related to the
equity awards that are not expected to vest for fiscal years 2014, 2013 and 2012 was $29.7 million, $27.1 million and $30.8
million, respectively.
Valuation Assumptions
We determine the fair value of stock option awards on the date of grant using an option-pricing model that is affected
by our stock price as well as assumptions regarding a number of highly complex and subjective variables. These variables
include, but are not limited to, weighted average expected term, risk-free interest rate, expected stock price volatility, dividend
yield, actual and projected employee stock option exercise behaviors, vesting schedules and death and disability probabilities.
We segregate options into groups of employees with relatively homogeneous exercise behavior in order to calculate the
best estimate of fair value using the binomial valuation model.
The expected life of employee stock options is a derived output of our valuation model and is impacted by the underlying
assumptions of our company. The risk-free interest rate assumption is based upon observed interest rates on Treasury bills
appropriate for the term of our employee stock options. Our management has determined that the use of implied volatility
is expected to be more reflective of market conditions and, therefore, can reasonably be expected to be a better indicator of
our expected volatility than historical volatility. Dividend yield is based on history and expectation of dividend payouts.
Our RSU awards are not eligible for cash dividends prior to vesting; therefore, the fair value of RSUs is discounted by the
dividend yield.
For awards granted on or subsequent to November 8, 2012, we use a dividend yield at grant date based on the per share
dividends declared during the most recent quarter. Additionally, for employee stock option and RSU awards, we estimate
forfeitures annually and revise the estimates of forfeiture in subsequent periods if actual forfeitures differ from those
estimates. Forfeitures are estimated based on historical experience.
The fair value of stock options granted under our stock option plans and shares issued under our employee stock purchase
plan have been estimated with the following assumptions: