NVIDIA 2013 Annual Report Download - page 247
Download and view the complete annual report
Please find page 247 of the 2013 NVIDIA annual report below. You can navigate through the pages in the report by either clicking on the pages listed below, or by using the keyword search tool below to find specific information within the annual report.-
 1
1 -
2
-
3
-
4
-
5
-
6
-
7
-
8
-
9
-
10
-
11
-
12
-
13
-
14
-
15
-
16
-
17
-
18
-
19
-
20
-
21
-
22
-
23
-
24
-
25
-
26
-
27
-
28
-
29
-
30
-
31
-
32
-
33
-
34
-
35
-
36
-
37
-
38
-
39
-
40
-
41
-
42
-
43
-
44
-
45
-
46
-
47
-
48
-
49
-
50
-
51
-
52
-
53
-
54
-
55
-
56
-
57
-
58
-
59
-
60
-
61
-
62
-
63
-
64
-
65
-
66
-
67
-
68
-
69
-
70
-
71
-
72
-
73
-
74
-
75
-
76
-
77
-
78
-
79
-
80
-
81
-
82
-
83
-
84
-
85
-
86
-
87
-
88
-
89
-
90
-
91
-
92
-
93
-
94
-
95
-
96
-
97
-
98
-
99
-
100
-
101
-
102
-
103
-
104
-
105
-
106
-
107
-
108
-
109
-
110
-
111
-
112
-
113
-
114
-
115
-
116
-
117
-
118
-
119
-
120
-
121
-
122
-
123
-
124
-
125
-
126
-
127
-
128
-
129
-
130
-
131
-
132
-
133
-
134
-
135
-
136
-
137
-
138
-
139
-
140
-
141
-
142
-
143
-
144
-
145
-
146
-
147
-
148
-
149
-
150
-
151
-
152
-
153
-
154
-
155
-
156
-
157
-
158
-
159
-
160
-
161
-
162
-
163
-
164
-
165
-
166
-
167
-
168
-
169
-
170
-
171
-
172
-
173
-
174
-
175
-
176
-
177
-
178
-
179
-
180
-
181
-
182
-
183
-
184
-
185
-
186
-
187
-
188
-
189
-
190
-
191
-
192
-
193
-
194
-
195
-
196
-
197
-
198
-
199
-
200
-
201
-
202
-
203
-
204
-
205
-
206
-
207
-
208
-
209
-
210
-
211
-
212
-
213
-
214
-
215
-
216
-
217
-
218
-
219
-
220
-
221
-
222
-
223
-
224
-
225
-
226
-
227
-
228
-
229
-
230
-
231
-
232
-
233
-
234
-
235
-
236
-
 237
237 -
 238
238 -
 239
239 -
 240
240 -
 241
241 -
 242
242 -
 243
243 -
 244
244 -
 245
245 -
 246
246 -
 247
247 -
 248
248 -
 249
249 -
 250
250 -
 251
251 -
 252
252 -
 253
253 -
 254
254 -
 255
255 -
 256
256 -
 257
257 -
258
-
259
-
260
-
261
-
262
-
263
-
264
 |
 |

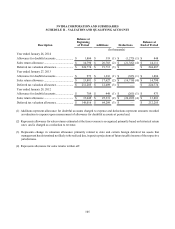
NVIDIA CORPORATION AND SUBSIDIARIES
NOTES TO THE CONSOLIDATED FINANCIAL STATEMENTS
(Continued)
103
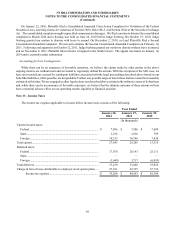
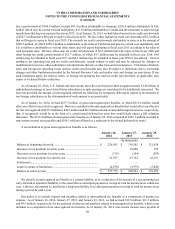
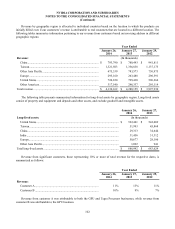
Accounts receivable from significant customers, those representing 10% or more of total accounts receivable for the
respective periods, is summarized as follows:
January 26,
2014 January 27,
2013
Accounts Receivable:
Customer A.................................................................................................................. 23% 20%
Customer B.................................................................................................................. 5% 10%
Customer C.................................................................................................................. 9% 10%
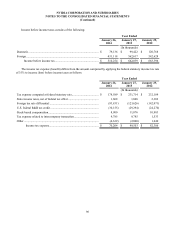
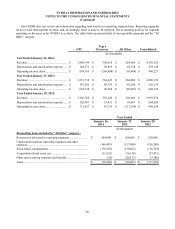
Note 17 - Quarterly Summary (Unaudited)
The following table sets forth our unaudited consolidated financial results, for the last eight fiscal quarters:
Fiscal Year 2014
Quarters Ended
January 26,
2014 October 27,
2013 July 28,
2013 April 28,
2013
(In thousands, except per share data)
Statement of Income Data:
Revenue................................................................... $ 1,144,218 $ 1,053,967 $ 977,238 $ 954,739
Cost of revenue ....................................................... $ 524,976 $ 469,552 $ 431,700 $ 436,171
Gross profit ............................................................. $ 619,242 $ 584,415 $ 545,538 $ 518,568
Net income.............................................................. $ 146,917 $ 118,734 $ 96,448 $ 77,891
Basic net income per share...................................... $ 0.26 $ 0.20 $ 0.16 $ 0.13
Diluted net income per share .................................. $ 0.25 $ 0.20 $ 0.16 $ 0.13
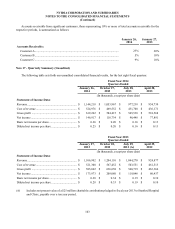
Fiscal Year 2013
Quarters Ended
January 27,
2013 October 28,
2012 July 29,
2012 (A) April 29,
2012
(In thousands, except per share data)
Statement of Income Data:
Revenue................................................................... $ 1,106,902 $ 1,204,110 $ 1,044,270 $ 924,877
Cost of revenue ....................................................... $ 521,300 $ 567,452 $ 503,551 $ 461,513
Gross profit ............................................................. $ 585,602 $ 636,658 $ 540,719 $ 463,364
Net income.............................................................. $ 173,973 $ 209,080 $ 119,046 $ 60,437
Basic net income per share...................................... $ 0.28 $ 0.34 $ 0.19 $ 0.10
Diluted net income per share .................................. $ 0.28 $ 0.33 $ 0.19 $ 0.10
(A) Includes net present value of a $25 million charitable contribution pledged in fiscal year 2013 to Stanford Hospital
and Clinic, payable over a ten year period.