NVIDIA 2013 Annual Report Download - page 196
Download and view the complete annual report
Please find page 196 of the 2013 NVIDIA annual report below. You can navigate through the pages in the report by either clicking on the pages listed below, or by using the keyword search tool below to find specific information within the annual report.-
 1
1 -
2
-
3
-
4
-
5
-
6
-
7
-
8
-
9
-
10
-
11
-
12
-
13
-
14
-
15
-
16
-
17
-
18
-
19
-
20
-
21
-
22
-
23
-
24
-
25
-
26
-
27
-
28
-
29
-
30
-
31
-
32
-
33
-
34
-
35
-
36
-
37
-
38
-
39
-
40
-
41
-
42
-
43
-
44
-
45
-
46
-
47
-
48
-
49
-
50
-
51
-
52
-
53
-
54
-
55
-
56
-
57
-
58
-
59
-
60
-
61
-
62
-
63
-
64
-
65
-
66
-
67
-
68
-
69
-
70
-
71
-
72
-
73
-
74
-
75
-
76
-
77
-
78
-
79
-
80
-
81
-
82
-
83
-
84
-
85
-
86
-
87
-
88
-
89
-
90
-
91
-
92
-
93
-
94
-
95
-
96
-
97
-
98
-
99
-
100
-
101
-
102
-
103
-
104
-
105
-
106
-
107
-
108
-
109
-
110
-
111
-
112
-
113
-
114
-
115
-
116
-
117
-
118
-
119
-
120
-
121
-
122
-
123
-
124
-
125
-
126
-
127
-
128
-
129
-
130
-
131
-
132
-
133
-
134
-
135
-
136
-
137
-
138
-
139
-
140
-
141
-
142
-
143
-
144
-
145
-
146
-
147
-
148
-
149
-
150
-
151
-
152
-
153
-
154
-
155
-
156
-
157
-
158
-
159
-
160
-
161
-
162
-
163
-
164
-
165
-
166
-
167
-
168
-
169
-
170
-
171
-
172
-
173
-
174
-
175
-
176
-
177
-
178
-
179
-
180
-
181
-
182
-
183
-
184
-
185
-
 186
186 -
 187
187 -
 188
188 -
 189
189 -
 190
190 -
 191
191 -
 192
192 -
 193
193 -
 194
194 -
 195
195 -
 196
196 -
 197
197 -
 198
198 -
 199
199 -
 200
200 -
 201
201 -
 202
202 -
 203
203 -
 204
204 -
 205
205 -
 206
206 -
207
-
208
-
209
-
210
-
211
-
212
-
213
-
214
-
215
-
216
-
217
-
218
-
219
-
220
-
221
-
222
-
223
-
224
-
225
-
226
-
227
-
228
-
229
-
230
-
231
-
232
-
233
-
234
-
235
-
236
-
237
-
238
-
239
-
240
-
241
-
242
-
243
-
244
-
245
-
246
-
247
-
248
-
249
-
250
-
251
-
252
-
253
-
254
-
255
-
256
-
257
-
258
-
259
-
260
-
261
-
262
-
263
-
264
 |
 |

52
in these fiscal years of the U.S. federal R&D tax credit and release of tax reserves as a result of the expiration of statutes
of limitations in certain non-U.S. jurisdictions for which we had not previously recognized related tax benefits.
Please refer to Note 13 of the Notes to the Consolidated Financial Statements in Part IV, Item 15 of this Annual Report
on Form 10-K for additional information.
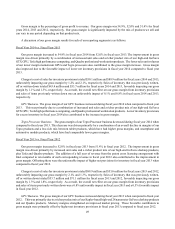
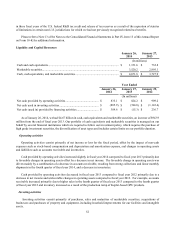
Liquidity and Capital Resources
January 26,
2014 January 27,
2013
(In millions)
Cash and cash equivalents................................................................................................ $ 1,151.6 $ 732.8
Marketable securities........................................................................................................ 3,520.2 2,995.1
Cash, cash equivalents, and marketable securities........................................................... $ 4,671.8 $ 3,727.9
Year Ended
January 26,
2014 January 27,
2013 January 29,
2012
(In millions)
Net cash provided by operating activities............................................. $ 835.1 $ 824.2 $ 909.2
Net cash used in investing activities..................................................... $(805.9) $ (744.0) $ (1,143.4)
Net cash (used in) provided by financing activities.............................. $ 389.6 $ (15.3) $ 236.7
As of January 26, 2014, we had $4.67 billion in cash, cash equivalents and marketable securities, an increase of $943.9
million from the end of fiscal year 2013. Our portfolio of cash equivalents and marketable securities is managed on our
behalf by several financial institutions which are required to follow our investment policy, which requires the purchase of
high grade investment securities, the diversification of asset types and includes certain limits on our portfolio duration.
Operating activities
Operating activities consist primarily of net income or loss for the fiscal period, offset by the impact of non-cash
expenses such as stock-based compensation and depreciation and amortization expense, and changes in operating assets
and liabilities such as accounts receivable and inventories.
Cash provided by operating activities increased slightly in fiscal year 2014 compared to fiscal year 2013 primarily due
to favorable changes in operating assets offset by a decrease in net income. The favorable change in operating assets was
driven mainly by a combination of a decrease in accounts receivable, resulting from strong collections and linear monthly
shipments in the fourth quarter of fiscal year 2014, and a decrease in inventories.
Cash provided by operating activities decreased in fiscal year 2013 compared to fiscal year 2012 primarily due to a
decrease in net income and unfavorable changes in operating assets compared to fiscal year 2012. For example, accounts
receivable increased primarily due to higher sales in the fourth quarter of fiscal year 2013 compared to the fourth quarter
of fiscal year 2012 and inventory increased as a result of the production ramp of Kepler-based GPU products.
Investing activities
Investing activities consist primarily of purchases, sales and maturities of marketable securities, acquisitions of
businesses and purchases of property and equipment, including leasehold improvements for our facilities and intangible
assets.