NVIDIA 2013 Annual Report Download - page 195
Download and view the complete annual report
Please find page 195 of the 2013 NVIDIA annual report below. You can navigate through the pages in the report by either clicking on the pages listed below, or by using the keyword search tool below to find specific information within the annual report.-
 1
1 -
2
-
3
-
4
-
5
-
6
-
7
-
8
-
9
-
10
-
11
-
12
-
13
-
14
-
15
-
16
-
17
-
18
-
19
-
20
-
21
-
22
-
23
-
24
-
25
-
26
-
27
-
28
-
29
-
30
-
31
-
32
-
33
-
34
-
35
-
36
-
37
-
38
-
39
-
40
-
41
-
42
-
43
-
44
-
45
-
46
-
47
-
48
-
49
-
50
-
51
-
52
-
53
-
54
-
55
-
56
-
57
-
58
-
59
-
60
-
61
-
62
-
63
-
64
-
65
-
66
-
67
-
68
-
69
-
70
-
71
-
72
-
73
-
74
-
75
-
76
-
77
-
78
-
79
-
80
-
81
-
82
-
83
-
84
-
85
-
86
-
87
-
88
-
89
-
90
-
91
-
92
-
93
-
94
-
95
-
96
-
97
-
98
-
99
-
100
-
101
-
102
-
103
-
104
-
105
-
106
-
107
-
108
-
109
-
110
-
111
-
112
-
113
-
114
-
115
-
116
-
117
-
118
-
119
-
120
-
121
-
122
-
123
-
124
-
125
-
126
-
127
-
128
-
129
-
130
-
131
-
132
-
133
-
134
-
135
-
136
-
137
-
138
-
139
-
140
-
141
-
142
-
143
-
144
-
145
-
146
-
147
-
148
-
149
-
150
-
151
-
152
-
153
-
154
-
155
-
156
-
157
-
158
-
159
-
160
-
161
-
162
-
163
-
164
-
165
-
166
-
167
-
168
-
169
-
170
-
171
-
172
-
173
-
174
-
175
-
176
-
177
-
178
-
179
-
180
-
181
-
182
-
183
-
184
-
 185
185 -
 186
186 -
 187
187 -
 188
188 -
 189
189 -
 190
190 -
 191
191 -
 192
192 -
 193
193 -
 194
194 -
 195
195 -
 196
196 -
 197
197 -
 198
198 -
 199
199 -
 200
200 -
 201
201 -
 202
202 -
 203
203 -
 204
204 -
 205
205 -
206
-
207
-
208
-
209
-
210
-
211
-
212
-
213
-
214
-
215
-
216
-
217
-
218
-
219
-
220
-
221
-
222
-
223
-
224
-
225
-
226
-
227
-
228
-
229
-
230
-
231
-
232
-
233
-
234
-
235
-
236
-
237
-
238
-
239
-
240
-
241
-
242
-
243
-
244
-
245
-
246
-
247
-
248
-
249
-
250
-
251
-
252
-
253
-
254
-
255
-
256
-
257
-
258
-
259
-
260
-
261
-
262
-
263
-
264
 |
 |

51
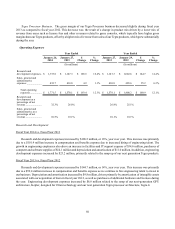
Sales, General and Administrative
Fiscal Year 2014 vs. Fiscal Year 2013
Sales, general and administrative expenses increased by $4.9 million, or 1%, year over year. This increase was primarily
due to a $37.9 million increase in compensation and benefits expense due to increased hiring. Offsetting this increase were
the absence of both a $20.1 million charge for a charitable contribution and a charge of $3.1 million for a class action
settlement that we recorded in the prior fiscal year.
Fiscal Year 2013 vs. Fiscal Year 2012
Sales, general and administrative expenses increased by $25.2 million, or 6%, year over year. This increase was
primarily due to a $21.6 million increase in compensation and benefits expense as we continue to invest in our business.
Also contributing to the increase was a $20.1 million expense for the net present value of a charitable contribution that we
recorded in the second quarter of fiscal year 2013. Offsetting these increases were decreases in outside professional fees
of $10.4 million due to an overall decrease in professional services costs during fiscal year 2013 compared with fiscal year
2012 due to a general decline in litigation-related costs and the absence of services associated with acquisition activity in
fiscal year 2013.
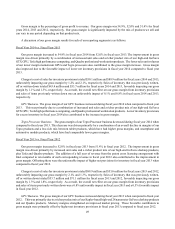
Interest Income and Interest Expense
Interest income consists of interest earned on cash, cash equivalents and marketable securities. Interest expense is
primarily comprised of coupon interest and debt discount amortization related to the convertible notes issued in the fourth
quarter of fiscal year 2014.
Interest income was $17.1 million, $19.9 million and $19.1 million in fiscal years 2014, 2013 and 2012, respectively.
The decrease in fiscal year 2014 from the prior year was primarily due to the result of lower average cash balances as we
liquidated a portion of our investment portfolio to fund an accelerated share repurchase transaction during the second quarter
of fiscal year 2014.
Interest expense was $10.4 million, $3.3 million, and $3.1 million in fiscal years 2014, 2013 and 2012, respectively.
The increase from prior year is attributable to $2.5 million for coupon interest and $4.6 million for debt discount amortization
related to the convertible notes. We expect to incur annual coupon interest expense of $15.0 million, and annual debt
discount amortization of $28.0 million, for fiscal year 2015.
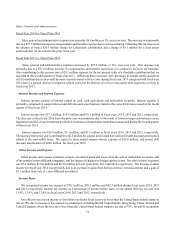
Other Income and Expense
Other income and expense primarily consists of realized gains and losses from the sale of marketable securities, sale
of investment in non-affiliated companies, and the impact of changes in foreign currency rates. Net other income (expense)
was $7.4 million, $(2.8) million and $(1.0) million in fiscal years 2014, 2013 and 2012, respectively. The increase in other
income for fiscal year 2014 was primarily due to an increase in gains from foreign currency remeasurements and a gain of
$3.1 million from sale of a non-affiliated investment.
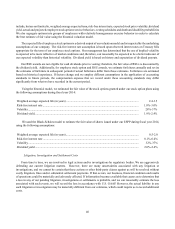
Income Taxes
We recognized income tax expense of $70.3 million, $99.5 million and $82.3 million during fiscal years 2014, 2013
and 2012, respectively. Income tax expense as a percentage of income before taxes, or our annual effective tax rate, was
13.8%, 15.0%, and 12.4% in fiscal years 2014, 2013 and 2012, respectively.
Our effective tax rate on income or loss before tax for the fiscal years was lower than the United States federal statutory
rate of 35% due to income or loss earned in jurisdictions, including British Virgin Islands, Hong Kong, China, Taiwan and
United Kingdom, where the tax rate is lower than the United States federal statutory tax rate of 35%, favorable recognition