NVIDIA 2013 Annual Report Download - page 188
Download and view the complete annual report
Please find page 188 of the 2013 NVIDIA annual report below. You can navigate through the pages in the report by either clicking on the pages listed below, or by using the keyword search tool below to find specific information within the annual report.-
 1
1 -
2
-
3
-
4
-
5
-
6
-
7
-
8
-
9
-
10
-
11
-
12
-
13
-
14
-
15
-
16
-
17
-
18
-
19
-
20
-
21
-
22
-
23
-
24
-
25
-
26
-
27
-
28
-
29
-
30
-
31
-
32
-
33
-
34
-
35
-
36
-
37
-
38
-
39
-
40
-
41
-
42
-
43
-
44
-
45
-
46
-
47
-
48
-
49
-
50
-
51
-
52
-
53
-
54
-
55
-
56
-
57
-
58
-
59
-
60
-
61
-
62
-
63
-
64
-
65
-
66
-
67
-
68
-
69
-
70
-
71
-
72
-
73
-
74
-
75
-
76
-
77
-
78
-
79
-
80
-
81
-
82
-
83
-
84
-
85
-
86
-
87
-
88
-
89
-
90
-
91
-
92
-
93
-
94
-
95
-
96
-
97
-
98
-
99
-
100
-
101
-
102
-
103
-
104
-
105
-
106
-
107
-
108
-
109
-
110
-
111
-
112
-
113
-
114
-
115
-
116
-
117
-
118
-
119
-
120
-
121
-
122
-
123
-
124
-
125
-
126
-
127
-
128
-
129
-
130
-
131
-
132
-
133
-
134
-
135
-
136
-
137
-
138
-
139
-
140
-
141
-
142
-
143
-
144
-
145
-
146
-
147
-
148
-
149
-
150
-
151
-
152
-
153
-
154
-
155
-
156
-
157
-
158
-
159
-
160
-
161
-
162
-
163
-
164
-
165
-
166
-
167
-
168
-
169
-
170
-
171
-
172
-
173
-
174
-
175
-
176
-
177
-
 178
178 -
 179
179 -
 180
180 -
 181
181 -
 182
182 -
 183
183 -
 184
184 -
 185
185 -
 186
186 -
 187
187 -
 188
188 -
 189
189 -
 190
190 -
 191
191 -
 192
192 -
 193
193 -
 194
194 -
 195
195 -
 196
196 -
 197
197 -
 198
198 -
199
-
200
-
201
-
202
-
203
-
204
-
205
-
206
-
207
-
208
-
209
-
210
-
211
-
212
-
213
-
214
-
215
-
216
-
217
-
218
-
219
-
220
-
221
-
222
-
223
-
224
-
225
-
226
-
227
-
228
-
229
-
230
-
231
-
232
-
233
-
234
-
235
-
236
-
237
-
238
-
239
-
240
-
241
-
242
-
243
-
244
-
245
-
246
-
247
-
248
-
249
-
250
-
251
-
252
-
253
-
254
-
255
-
256
-
257
-
258
-
259
-
260
-
261
-
262
-
263
-
264
 |
 |
44
Both a qualitative and quantitative approach are applicable accounting standards for the assessment of goodwill
impairment. With the qualitative approach to testing goodwill for impairment, we perform an analysis evaluating factors
including, but not limited to, macro-economic conditions, market and industry conditions, the competitive environment,
the operational stability and overall financial performance of the reporting units, including cost factors and actual revenue
results. For reporting units in which the qualitative assessment concludes it is more likely than not that the fair value is more
than its carrying value, no further goodwill impairment testing is required.
For those reporting units where a significant change or event has occurred, where potential impairment indicators exist,
or for which we have not performed a quantitative assessment recently, we utilize a two-step quantitative assessment to
testing goodwill for impairment. The first step tests for possible impairment by applying a fair value-based test. The second
step, if necessary, measures the amount of such impairment by applying fair value-based tests to individual assets and
liabilities. We estimated the fair value of reporting units by weighing the results from the income approach and the market
approach. These valuation approaches consider a number of factors that include, but are not limited to, prospective financial
information, growth rates, terminal or residual values, discount rates and comparable multiples from publicly traded
companies in our industry and require us to make certain assumptions and estimates regarding industry economic factors
and the future profitability of our business.
When performing an income approach valuation, we incorporate the use of projected financial information and a
discount rate that are developed using market participant based assumptions to our discounted cash flow model. Our
estimates of discounted cash flow were based upon, among other things, certain assumptions about our expected future
operating performance, such as revenue growth rates, operating margins, risk-adjusted discount rates, and future economic
and market conditions. Our estimates may differ from actual cash flow due to, among other things, economic conditions,
changes to our business model or changes in operating performance. Additionally, certain estimates of discounted cash flow
involve businesses with limited financial history and developing revenue models, which increases the risk of differences
between the projected and actual performance. The long-term financial forecasts that we utilize represent the best estimate
that we have at this time and we believe that its underlying assumptions are reasonable. Significant differences between
our estimates and actual cash flow could materially affect our future financial results, which could impact our future estimates
of the fair value of our reporting unit.
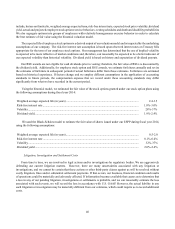
During the fourth quarter of fiscal year 2014, we utilized a quantitative assessment to test goodwill impairment for all
three reporting units and concluded that there was no impairment, as the fair value of our GPU and Professional Solutions
reporting units significantly exceeded their carrying values and the fair value of our Tegra Processor reporting unit exceeded
its carrying value by 17%. As such, even if we applied a hypothetical 10% decrease to the fair value of each reporting unit,
it still would not have resulted in the fair value of our reporting units being less than their carrying values. As an overall
test of the reasonableness of estimated fair values of reporting units, we reconciled the combined fair value estimates of
our reporting units to our market capitalization as of the valuation date of October 27, 2013. The reconciliation confirmed
that the fair values were relatively representative of the market views when applying a reasonable control premium to the
market capitalization. However, any significant reductions in the actual amount of future cash flows realized by our reporting
units, reductions in the value of market comparables, or reductions in our market capitalization could impact future estimates
of the fair values of our reporting units. Such events could ultimately result in a charge to our earnings in future periods
due to the potential for a write-down of the goodwill associated with our reporting units.
In particular, the fair value of our Tegra reporting unit exceeded its carrying value by approximately 17%. The fair
value of this reporting unit was assessed using a combination of income and market approaches. The underlying assumptions
we used in assessing the fair value of the Tegra reporting unit include, but are not limited to, assumptions around future
revenue growth rates, gross margins, operating expense investment levels, overall market growth rates, our market share
of the overall market, and the appropriate discount rates to apply to future cash flows. If the actual future results of the Tegra
reporting unit do not achieve the levels we estimated in assessing its fair value, the fair value of the Tegra reporting unit
could decline. A future decline in the fair value of the Tegra reporting unit could result a charge to our earnings as a result
of a write-down of the value of the goodwill associated with that reporting unit.