NVIDIA 2013 Annual Report Download - page 194
Download and view the complete annual report
Please find page 194 of the 2013 NVIDIA annual report below. You can navigate through the pages in the report by either clicking on the pages listed below, or by using the keyword search tool below to find specific information within the annual report.-
 1
1 -
2
-
3
-
4
-
5
-
6
-
7
-
8
-
9
-
10
-
11
-
12
-
13
-
14
-
15
-
16
-
17
-
18
-
19
-
20
-
21
-
22
-
23
-
24
-
25
-
26
-
27
-
28
-
29
-
30
-
31
-
32
-
33
-
34
-
35
-
36
-
37
-
38
-
39
-
40
-
41
-
42
-
43
-
44
-
45
-
46
-
47
-
48
-
49
-
50
-
51
-
52
-
53
-
54
-
55
-
56
-
57
-
58
-
59
-
60
-
61
-
62
-
63
-
64
-
65
-
66
-
67
-
68
-
69
-
70
-
71
-
72
-
73
-
74
-
75
-
76
-
77
-
78
-
79
-
80
-
81
-
82
-
83
-
84
-
85
-
86
-
87
-
88
-
89
-
90
-
91
-
92
-
93
-
94
-
95
-
96
-
97
-
98
-
99
-
100
-
101
-
102
-
103
-
104
-
105
-
106
-
107
-
108
-
109
-
110
-
111
-
112
-
113
-
114
-
115
-
116
-
117
-
118
-
119
-
120
-
121
-
122
-
123
-
124
-
125
-
126
-
127
-
128
-
129
-
130
-
131
-
132
-
133
-
134
-
135
-
136
-
137
-
138
-
139
-
140
-
141
-
142
-
143
-
144
-
145
-
146
-
147
-
148
-
149
-
150
-
151
-
152
-
153
-
154
-
155
-
156
-
157
-
158
-
159
-
160
-
161
-
162
-
163
-
164
-
165
-
166
-
167
-
168
-
169
-
170
-
171
-
172
-
173
-
174
-
175
-
176
-
177
-
178
-
179
-
180
-
181
-
182
-
183
-
 184
184 -
 185
185 -
 186
186 -
 187
187 -
 188
188 -
 189
189 -
 190
190 -
 191
191 -
 192
192 -
 193
193 -
 194
194 -
 195
195 -
 196
196 -
 197
197 -
 198
198 -
 199
199 -
 200
200 -
 201
201 -
 202
202 -
 203
203 -
 204
204 -
205
-
206
-
207
-
208
-
209
-
210
-
211
-
212
-
213
-
214
-
215
-
216
-
217
-
218
-
219
-
220
-
221
-
222
-
223
-
224
-
225
-
226
-
227
-
228
-
229
-
230
-
231
-
232
-
233
-
234
-
235
-
236
-
237
-
238
-
239
-
240
-
241
-
242
-
243
-
244
-
245
-
246
-
247
-
248
-
249
-
250
-
251
-
252
-
253
-
254
-
255
-
256
-
257
-
258
-
259
-
260
-
261
-
262
-
263
-
264
 |
 |

50
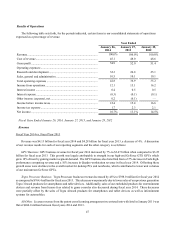
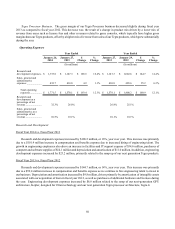
Tegra Processor Business. The gross margin of our Tegra Processor business decreased slightly during fiscal year
2013 as compared to fiscal year 2012. This decrease was the result of a change in product mix driven by a lower mix of
revenue from areas such as license fees and other revenues related to game consoles, which typically have higher gross
margins than our Tegra products, offset by a higher mix of revenue from sales of our Tegra products, which grew substantially
during the year.
Operating Expenses
Year Ended Year Ended
January 26,
2014 January 27,
2013 $
Change %
Change January 27,
2013 January 29,
2012 $
Change %
Change
(In millions) (In millions)
Research and
development expenses.$ 1,335.8 $ 1,147.3 $ 188.5 16.4% $ 1,147.3 $ 1,002.6 $ 144.7 14.4%
Sales, general and
administrative
expenses ...................... 435.7 430.8 4.9 1.1% 430.8 405.6 25.2 6.2%
Total operating
expenses................. $ 1,771.5 $ 1,578.1 $ 193.4 12.3% $ 1,578.1 $ 1,408.2 $ 169.9 12.1%
Research and
development as a
percentage of net
revenue ........................ 32.3% 26.8% 26.8% 25.1%
Sales, general and
administrative as a
percentage of net
revenue ........................ 10.5% 10.1% 10.1% 10.1%
Research and Development
Fiscal Year 2014 vs. Fiscal Year 2013
Research and development expenses increased by $188.5 million, or 16%, year over year. This increase was primarily
due to a $101.9 million increase in compensation and benefits expense due to increased hiring of engineering talent. The
growth in engineering employees also drove an increase in facilities and IT support expense of $34.6 million, purchases of
computer and software supplies of $14.1 million and depreciation and amortization of $11.0 million. In addition, engineering
development expenses increased by $23.2 million, primarily related to the ramp up of our next generation Tegra products.
Fiscal Year 2013 vs. Fiscal Year 2012
Research and development expenses increased by $144.7 million, or 14%, year over year. This increase was primarily
due to a $99.4 million increase in compensation and benefits expense as we continue to hire engineering talent to invest in
our business. Depreciation and amortization increased by $9.8 million, driven primarily by amortization of intangible assets
associated with our acquisition of Icera in fiscal year 2012, as well as purchases of additional hardware and licenses during
the year. Engineering development expenses increased by $6.8 million related to the ramp of our next-generation GPU
architecture, Kepler, designed for 28nm technology and our next generation Tegra processor architecture, Tegra 4.