NVIDIA 2013 Annual Report Download - page 193
Download and view the complete annual report
Please find page 193 of the 2013 NVIDIA annual report below. You can navigate through the pages in the report by either clicking on the pages listed below, or by using the keyword search tool below to find specific information within the annual report.-
 1
1 -
2
-
3
-
4
-
5
-
6
-
7
-
8
-
9
-
10
-
11
-
12
-
13
-
14
-
15
-
16
-
17
-
18
-
19
-
20
-
21
-
22
-
23
-
24
-
25
-
26
-
27
-
28
-
29
-
30
-
31
-
32
-
33
-
34
-
35
-
36
-
37
-
38
-
39
-
40
-
41
-
42
-
43
-
44
-
45
-
46
-
47
-
48
-
49
-
50
-
51
-
52
-
53
-
54
-
55
-
56
-
57
-
58
-
59
-
60
-
61
-
62
-
63
-
64
-
65
-
66
-
67
-
68
-
69
-
70
-
71
-
72
-
73
-
74
-
75
-
76
-
77
-
78
-
79
-
80
-
81
-
82
-
83
-
84
-
85
-
86
-
87
-
88
-
89
-
90
-
91
-
92
-
93
-
94
-
95
-
96
-
97
-
98
-
99
-
100
-
101
-
102
-
103
-
104
-
105
-
106
-
107
-
108
-
109
-
110
-
111
-
112
-
113
-
114
-
115
-
116
-
117
-
118
-
119
-
120
-
121
-
122
-
123
-
124
-
125
-
126
-
127
-
128
-
129
-
130
-
131
-
132
-
133
-
134
-
135
-
136
-
137
-
138
-
139
-
140
-
141
-
142
-
143
-
144
-
145
-
146
-
147
-
148
-
149
-
150
-
151
-
152
-
153
-
154
-
155
-
156
-
157
-
158
-
159
-
160
-
161
-
162
-
163
-
164
-
165
-
166
-
167
-
168
-
169
-
170
-
171
-
172
-
173
-
174
-
175
-
176
-
177
-
178
-
179
-
180
-
181
-
182
-
 183
183 -
 184
184 -
 185
185 -
 186
186 -
 187
187 -
 188
188 -
 189
189 -
 190
190 -
 191
191 -
 192
192 -
 193
193 -
 194
194 -
 195
195 -
 196
196 -
 197
197 -
 198
198 -
 199
199 -
 200
200 -
 201
201 -
 202
202 -
 203
203 -
204
-
205
-
206
-
207
-
208
-
209
-
210
-
211
-
212
-
213
-
214
-
215
-
216
-
217
-
218
-
219
-
220
-
221
-
222
-
223
-
224
-
225
-
226
-
227
-
228
-
229
-
230
-
231
-
232
-
233
-
234
-
235
-
236
-
237
-
238
-
239
-
240
-
241
-
242
-
243
-
244
-
245
-
246
-
247
-
248
-
249
-
250
-
251
-
252
-
253
-
254
-
255
-
256
-
257
-
258
-
259
-
260
-
261
-
262
-
263
-
264
 |
 |

49
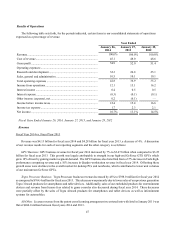
Gross margin is the percentage of gross profit to revenue. Our gross margin was 54.9%, 52.0% and 51.4% for fiscal
years 2014, 2013 and 2012, respectively. Our gross margin is significantly impacted by the mix of products we sell and
can vary in any period depending on that product mix.
A discussion of our gross margin results for each of our reporting segments is as follows:
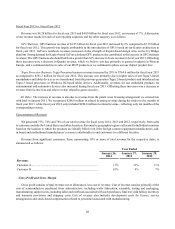
Fiscal Year 2014 vs. Fiscal Year 2013
Our gross margin increased to 54.9% in fiscal year 2014 from 52.0% in fiscal year 2013. The improvement in gross
margin was driven primarily by a combination of increased unit sales and a richer product mix of our high-end GeForce
GTX GPU, Tesla high performance computing, and Quadro professional workstation products. The lower sales unit volumes
of our lower margin mainstream GPUs and Tegra processors also contributed to the gross margin increase. Gross margin
also improved due to the favorable impact of lower net inventory provisions in fiscal year 2014 compared to fiscal year
2013.
Charges to cost of sales for inventory provisions totaled $50.1 million and $89.9 million for fiscal years 2014 and 2013,
unfavorably impacting our gross margin by 1.2% and 2.1%, respectively. Sales of inventory that was previously written-
off or written-down totaled $43.4 million and $53.7 million for fiscal years 2014 and 2013, favorably impacting our gross
margin by 1.1% and 1.3%, respectively. As a result, the overall net effect on our gross margin from inventory provisions
and sales of items previously written down was an unfavorable impact of 0.1% and 0.8% in fiscal years 2014 and 2013,
respectively.
GPU Business. The gross margin of our GPU business increased during fiscal year 2014 when compared to fiscal year
2013. This was primarily due to a combination of increased unit sales and a richer product mix of our high-end GeForce
GTX GPU, Tesla high performance computing, and Quadro professional workstation products. Lower inventory provisions
for excess inventory in fiscal year 2014 also contributed to the increase in gross margin.
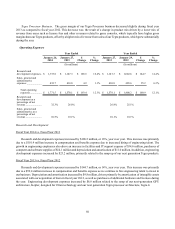
Tegra Processor Business. The gross margin of our Tegra Processor business decreased during fiscal year 2014 when
compared to fiscal year 2013. This decrease was driven primarily by a combination of an overall decline in margins of our
Tegra products and a less rich mix between tablet products, which have had higher gross margins, and smartphone and
automotive module products, which have had comparably lower gross margins.
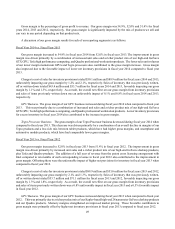
Fiscal Year 2013 vs. Fiscal Year 2012
Our gross margin increased to 52.0% in fiscal year 2013 from 51.4% in fiscal year 2012. The improvement in gross
margin was driven primarily by increased unit sales and a richer product mix of our high-end GeForce desktop products,
plus Tesla and Quadro products. The addition of a full year of revenue from the patent cross licensing arrangement with
Intel compared to ten months of such corresponding revenue in fiscal year 2012 also contributed to the improvement in
gross margin. Offsetting these were the unfavorable impact of higher net provisions for inventory in fiscal year 2013 when
compared to fiscal year 2012.
Charges to cost of sales for inventory provisions totaled $89.9 million and $53.0 million for fiscal years 2013 and 2012,
unfavorably impacting our gross margin by 2.1% and 1.3%, respectively. Sales of inventory that was previously written-
off or written down totaled $53.7 million and $71.1 million for fiscal years 2013 and 2012, favorably impacting our gross
margin by 1.3% and 1.8%, respectively. As a result, the overall net effect on our gross margin from inventory provisions
and sales of items previously written down was a 0.8% unfavorable impact in fiscal year 2013 and a 0.5% favorable impact
in fiscal year 2012.
GPU Business. The gross margin of our GPU business increased during fiscal year 2013 when compared to fiscal year
2012. This was primarily due to a richer product mix of our Kepler-based high-end 28 nanometer GeForce desktop products
and our Quadro products. Memory margins strengthened on improved market pricing. These favorable contributors to
gross margin were primarily offset by higher net inventory provisions in fiscal year 2013 compared to fiscal year 2012.