NVIDIA 2013 Annual Report Download - page 68
Download and view the complete annual report
Please find page 68 of the 2013 NVIDIA annual report below. You can navigate through the pages in the report by either clicking on the pages listed below, or by using the keyword search tool below to find specific information within the annual report.-
 1
1 -
2
-
3
-
4
-
5
-
6
-
7
-
8
-
9
-
10
-
11
-
12
-
13
-
14
-
15
-
16
-
17
-
18
-
19
-
20
-
21
-
22
-
23
-
24
-
25
-
26
-
27
-
28
-
29
-
30
-
31
-
32
-
33
-
34
-
35
-
36
-
37
-
38
-
39
-
40
-
41
-
42
-
43
-
44
-
45
-
46
-
47
-
48
-
49
-
50
-
51
-
52
-
53
-
54
-
55
-
56
-
57
-
 58
58 -
 59
59 -
 60
60 -
 61
61 -
 62
62 -
 63
63 -
 64
64 -
 65
65 -
 66
66 -
 67
67 -
 68
68 -
 69
69 -
 70
70 -
 71
71 -
 72
72 -
 73
73 -
 74
74 -
 75
75 -
 76
76 -
 77
77 -
 78
78 -
79
-
80
-
81
-
82
-
83
-
84
-
85
-
86
-
87
-
88
-
89
-
90
-
91
-
92
-
93
-
94
-
95
-
96
-
97
-
98
-
99
-
100
-
101
-
102
-
103
-
104
-
105
-
106
-
107
-
108
-
109
-
110
-
111
-
112
-
113
-
114
-
115
-
116
-
117
-
118
-
119
-
120
-
121
-
122
-
123
-
124
-
125
-
126
-
127
-
128
-
129
-
130
-
131
-
132
-
133
-
134
-
135
-
136
-
137
-
138
-
139
-
140
-
141
-
142
-
143
-
144
-
145
-
146
-
147
-
148
-
149
-
150
-
151
-
152
-
153
-
154
-
155
-
156
-
157
-
158
-
159
-
160
-
161
-
162
-
163
-
164
-
165
-
166
-
167
-
168
-
169
-
170
-
171
-
172
-
173
-
174
-
175
-
176
-
177
-
178
-
179
-
180
-
181
-
182
-
183
-
184
-
185
-
186
-
187
-
188
-
189
-
190
-
191
-
192
-
193
-
194
-
195
-
196
-
197
-
198
-
199
-
200
-
201
-
202
-
203
-
204
-
205
-
206
-
207
-
208
-
209
-
210
-
211
-
212
-
213
-
214
-
215
-
216
-
217
-
218
-
219
-
220
-
221
-
222
-
223
-
224
-
225
-
226
-
227
-
228
-
229
-
230
-
231
-
232
-
233
-
234
-
235
-
236
-
237
-
238
-
239
-
240
-
241
-
242
-
243
-
244
-
245
-
246
-
247
-
248
-
249
-
250
-
251
-
252
-
253
-
254
-
255
-
256
-
257
-
258
-
259
-
260
-
261
-
262
-
263
-
264
 |
 |

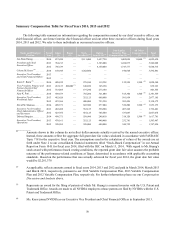
50
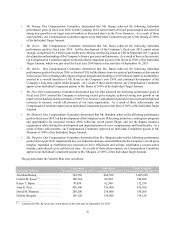
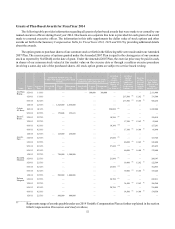
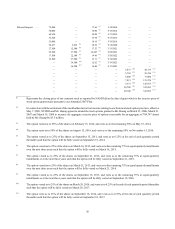
Summary Compensation Table for Fiscal Years 2014, 2013 and 2012
The following table summarizes information regarding the compensation earned by our chief executive officer, our
chief financial officer, our former interim chief financial officer and our other three executive officers during fiscal years
2014, 2013 and 2012. We refer to these individuals as our named executive officers.
Name and Principal
Position
Fiscal
Year
Salary
($)
Bonus
($)
Stock
Awards ($) (1) Option
Awards ($) (1)
Non-Equity
Incentive Plan
Compensation ($) (2)
All Other
Compensation
($)
Total
($)
Jen-Hsun Huang. . . . . . . . . . 2014 837,450 — 2,111,400 1,657,750 1,405,030 11,000 (3) 6,022,630
President and Chief
Executive Officer
2013 784,213 — — 3,303,000 1,454,875 — 5,542,088
2012 746,539 — — 4,150,000 1,743,777 — 6,640,316
Colette M. Kress (4) . . . . . . . 2014 158,945 — 3,242,800 — 190,668 — 3,592,841
Executive Vice President
and Chief Financial Officer
2013 — — — — — — —
2012 — — — — — — —
Karen T. Burns (5) . . . . . . . . . 2014 488,832 — 278,100 119,358 132,550 1,500 (6) 1,020,340
Vice President, Finance and
Former Interim Chief
Financial Officer
2013 433,123 100,000 (7) 140,850 165,150 — — 839,123
2012 333,085 — 197,290 273,180 — — 803,555
Ajay K. Puri . . . . . . . . . . . . . 2014 498,479 — 745,200 321,080 815,300 1,500 (6) 2,381,559
Executive Vice President,
Worldwide Sales
2013 482,426 — 352,125 660,600 581,954 — 2,077,105
2012 423,366 — 400,000 723,350 583,456 — 2,130,172
David M. Shannon . . . . . . . . 2014 498,371 — 645,300 277,804 530,200 1,500 (6) 1,953,175
Executive Vice President,
Chief Administrative Officer
and Secretary
2013 482,488 — 352,125 550,500 407,368 — 1,792,481
2012 423,366 — 401,125 705,500 537,083 — 2,067,074
Debora Shoquist. . . . . . . . . . 2014 498,371 — 558,900 240,810 318,120 1,500 (6) 1,617,701
Executive Vice President,
Operations
2013 478,161 — 352,125 440,400 232,781 — 1,503,467
2012 398,269 — 320,000 680,800 348,755 — 1,747,824
__________
(1) Amounts shown in this column do not reflect dollar amounts actually received by the named executive officer.
Instead, these amounts reflect the aggregate full grant date fair value calculated in accordance with FASB ASC
Topic 718 for the respective fiscal year. The assumptions used in the calculation of values of the awards are set
forth under Note 2 to our consolidated financial statements titled “Stock-Based Compensation” in our Annual
Report on Form 10-K for fiscal year 2014, filed with the SEC on March 13, 2014. With regard to Mr. Huang’s
stock award with performance-based vesting conditions, the reported grant date fair value assumes the probable
outcome of the performance-related conditions at Target, determined in accordance with applicable accounting
standards. Based on the performance that was actually achieved for fiscal year 2014, the grant date fair value
would be $2,281,379.
(2) As applicable, reflects amounts earned in fiscal years 2014, 2013 and 2012 and paid in March 2014, March 2013
and March 2012, respectively, pursuant to our 2014 Variable Compensation Plan, 2013 Variable Compensation
Plan and 2012 Variable Compensation Plan, respectively. For further information please see our Compensation
Discussion and Analysis above.
(3) Represents an award for the filing of patents of which Mr. Huang is a named inventor with the U.S. Patent and
Trademark Office. Awards are made to all NVIDIA employees whose patents are filed by NVIDIA with the U.S.
Patent and Trademark Office.
(4) Ms. Kress joined NVIDIA as our Executive Vice President and Chief Financial Officer in September 2013.