NVIDIA 2013 Annual Report Download - page 207
Download and view the complete annual report
Please find page 207 of the 2013 NVIDIA annual report below. You can navigate through the pages in the report by either clicking on the pages listed below, or by using the keyword search tool below to find specific information within the annual report.-
 1
1 -
2
-
3
-
4
-
5
-
6
-
7
-
8
-
9
-
10
-
11
-
12
-
13
-
14
-
15
-
16
-
17
-
18
-
19
-
20
-
21
-
22
-
23
-
24
-
25
-
26
-
27
-
28
-
29
-
30
-
31
-
32
-
33
-
34
-
35
-
36
-
37
-
38
-
39
-
40
-
41
-
42
-
43
-
44
-
45
-
46
-
47
-
48
-
49
-
50
-
51
-
52
-
53
-
54
-
55
-
56
-
57
-
58
-
59
-
60
-
61
-
62
-
63
-
64
-
65
-
66
-
67
-
68
-
69
-
70
-
71
-
72
-
73
-
74
-
75
-
76
-
77
-
78
-
79
-
80
-
81
-
82
-
83
-
84
-
85
-
86
-
87
-
88
-
89
-
90
-
91
-
92
-
93
-
94
-
95
-
96
-
97
-
98
-
99
-
100
-
101
-
102
-
103
-
104
-
105
-
106
-
107
-
108
-
109
-
110
-
111
-
112
-
113
-
114
-
115
-
116
-
117
-
118
-
119
-
120
-
121
-
122
-
123
-
124
-
125
-
126
-
127
-
128
-
129
-
130
-
131
-
132
-
133
-
134
-
135
-
136
-
137
-
138
-
139
-
140
-
141
-
142
-
143
-
144
-
145
-
146
-
147
-
148
-
149
-
150
-
151
-
152
-
153
-
154
-
155
-
156
-
157
-
158
-
159
-
160
-
161
-
162
-
163
-
164
-
165
-
166
-
167
-
168
-
169
-
170
-
171
-
172
-
173
-
174
-
175
-
176
-
177
-
178
-
179
-
180
-
181
-
182
-
183
-
184
-
185
-
186
-
187
-
188
-
189
-
190
-
191
-
192
-
193
-
194
-
195
-
196
-
 197
197 -
 198
198 -
 199
199 -
 200
200 -
 201
201 -
 202
202 -
 203
203 -
 204
204 -
 205
205 -
 206
206 -
 207
207 -
 208
208 -
 209
209 -
 210
210 -
 211
211 -
 212
212 -
 213
213 -
 214
214 -
 215
215 -
 216
216 -
 217
217 -
218
-
219
-
220
-
221
-
222
-
223
-
224
-
225
-
226
-
227
-
228
-
229
-
230
-
231
-
232
-
233
-
234
-
235
-
236
-
237
-
238
-
239
-
240
-
241
-
242
-
243
-
244
-
245
-
246
-
247
-
248
-
249
-
250
-
251
-
252
-
253
-
254
-
255
-
256
-
257
-
258
-
259
-
260
-
261
-
262
-
263
-
264
 |
 |

63
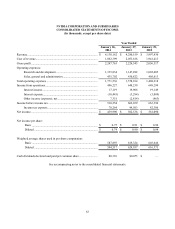
NVIDIA CORPORATION AND SUBSIDIARIES
CONSOLIDATED STATEMENTS OF INCOME
(In thousands, except per share data)
Year Ended
January 26,
2014 January 27,
2013 January 29,
2012
Revenue............................................................................................... $ 4,130,162 $ 4,280,159 $ 3,997,930
Cost of revenue.................................................................................... 1,862,399 2,053,816 1,941,413
Gross profit.......................................................................................... 2,267,763 2,226,343 2,056,517
Operating expenses:
Research and development ........................................................ 1,335,834 1,147,282 1,002,605
Sales, general and administrative............................................... 435,702 430,822 405,613
Total operating expenses ..................................................................... 1,771,536 1,578,104 1,408,218
Income from operations....................................................................... 496,227 648,239 648,299
Interest income........................................................................... 17,119 19,908 19,149
Interest expense.......................................................................... (10,443)(3,294)(3,089)
Other income (expense), net ...................................................... 7,351 (2,814)(963)
Income before income tax ................................................................... 510,254 662,039 663,396
Income tax expense.................................................................... 70,264 99,503 82,306
Net income........................................................................................... $ 439,990 $ 562,536 $ 581,090
Net income per share:
Basic ......................................................................................... $ 0.75 $ 0.91 $ 0.96
Diluted ...................................................................................... $ 0.74 $ 0.90 $ 0.94
Weighted average shares used in per share computation:
Basic ......................................................................................... 587,893 619,324 603,646
Diluted ...................................................................................... 594,517 624,957 616,371
Cash dividends declared and paid per common share......................... $0.310 $0.075 $ —
See accompanying notes to the consolidated financial statements.