NVIDIA 2013 Annual Report Download - page 176
Download and view the complete annual report
Please find page 176 of the 2013 NVIDIA annual report below. You can navigate through the pages in the report by either clicking on the pages listed below, or by using the keyword search tool below to find specific information within the annual report.-
 1
1 -
2
-
3
-
4
-
5
-
6
-
7
-
8
-
9
-
10
-
11
-
12
-
13
-
14
-
15
-
16
-
17
-
18
-
19
-
20
-
21
-
22
-
23
-
24
-
25
-
26
-
27
-
28
-
29
-
30
-
31
-
32
-
33
-
34
-
35
-
36
-
37
-
38
-
39
-
40
-
41
-
42
-
43
-
44
-
45
-
46
-
47
-
48
-
49
-
50
-
51
-
52
-
53
-
54
-
55
-
56
-
57
-
58
-
59
-
60
-
61
-
62
-
63
-
64
-
65
-
66
-
67
-
68
-
69
-
70
-
71
-
72
-
73
-
74
-
75
-
76
-
77
-
78
-
79
-
80
-
81
-
82
-
83
-
84
-
85
-
86
-
87
-
88
-
89
-
90
-
91
-
92
-
93
-
94
-
95
-
96
-
97
-
98
-
99
-
100
-
101
-
102
-
103
-
104
-
105
-
106
-
107
-
108
-
109
-
110
-
111
-
112
-
113
-
114
-
115
-
116
-
117
-
118
-
119
-
120
-
121
-
122
-
123
-
124
-
125
-
126
-
127
-
128
-
129
-
130
-
131
-
132
-
133
-
134
-
135
-
136
-
137
-
138
-
139
-
140
-
141
-
142
-
143
-
144
-
145
-
146
-
147
-
148
-
149
-
150
-
151
-
152
-
153
-
154
-
155
-
156
-
157
-
158
-
159
-
160
-
161
-
162
-
163
-
164
-
165
-
 166
166 -
 167
167 -
 168
168 -
 169
169 -
 170
170 -
 171
171 -
 172
172 -
 173
173 -
 174
174 -
 175
175 -
 176
176 -
 177
177 -
 178
178 -
 179
179 -
 180
180 -
 181
181 -
 182
182 -
 183
183 -
 184
184 -
 185
185 -
 186
186 -
187
-
188
-
189
-
190
-
191
-
192
-
193
-
194
-
195
-
196
-
197
-
198
-
199
-
200
-
201
-
202
-
203
-
204
-
205
-
206
-
207
-
208
-
209
-
210
-
211
-
212
-
213
-
214
-
215
-
216
-
217
-
218
-
219
-
220
-
221
-
222
-
223
-
224
-
225
-
226
-
227
-
228
-
229
-
230
-
231
-
232
-
233
-
234
-
235
-
236
-
237
-
238
-
239
-
240
-
241
-
242
-
243
-
244
-
245
-
246
-
247
-
248
-
249
-
250
-
251
-
252
-
253
-
254
-
255
-
256
-
257
-
258
-
259
-
260
-
261
-
262
-
263
-
264
 |
 |

32
belief that liabilities, while possible, are not probable. Further, any possible range of loss in these matters cannot be reasonably
estimated at this time. We are engaged in other legal actions not described above arising in the ordinary course of its business
and, while there can be no assurance of favorable outcomes, we believe that the ultimate outcome of these actions will not
have a material adverse effect on our operating results, liquidity or financial position.
ITEM 4. MINE SAFETY DISCLOSURES
Not Applicable.
PART II
ITEM 5. MARKET FOR REGISTRANT’S COMMON EQUITY, RELATED STOCKHOLDER MATTERS AND
ISSUER PURCHASES OF EQUITY SECURITIES
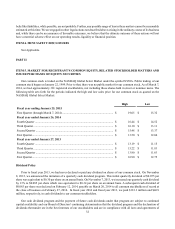
Our common stock is traded on the NASDAQ Global Select Market under the symbol NVDA. Public trading of our
common stock began on January 22, 1999. Prior to that, there was no public market for our common stock. As of March 7,
2014, we had approximately 381 registered stockholders, not including those shares held in street or nominee name. The
following table sets forth for the periods indicated the high and low sales price for our common stock as quoted on the
NASDAQ Global Select Market:
High Low
Fiscal year ending January 25, 2015
First Quarter (through March 7, 2014) ..................................................................... $ 19.05 $ 15.32
Fiscal year ended January 26, 2014
Fourth Quarter .......................................................................................................... $ 16.44 $ 14.52
Third Quarter ............................................................................................................ $ 16.10 $ 13.11
Second Quarter ......................................................................................................... $ 15.48 $ 13.37
First Quarter.............................................................................................................. $ 13.50 $ 12.04
Fiscal year ended January 27, 2013
Fourth Quarter .......................................................................................................... $ 13.19 $ 11.15
Third Quarter ............................................................................................................ $ 15.22 $ 11.83
Second Quarter ......................................................................................................... $ 13.90 $ 11.63
First Quarter.............................................................................................................. $ 16.90 $ 12.75
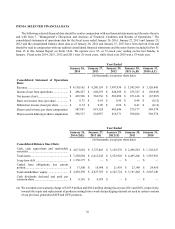
Dividend Policy
Prior to fiscal year 2013, we had never declared or paid any dividend on shares of our common stock. On November
8, 2012, we announced the initiation of a quarterly cash dividend program. This initial quarterly dividend of $0.075 per
share was equivalent to $0.30 per share on an annual basis. On November 7, 2013, we increased our quarterly cash dividend
by 13% to $0.085 per share which was equivalent to $0.34 per share on an annual basis. A subsequent cash dividend of
$0.085 per share was declared on February 12, 2014, payable on March 20, 2014 to all common stockholders of record at
the close of business on February 27, 2014. In fiscal year 2014 and fiscal year 2013, we paid $181.3 million and $46.9
million, respectively, in cash dividends to our common stockholders.
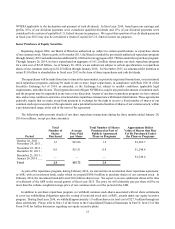
Our cash dividend program and the payment of future cash dividends under that program are subject to continued
capital availability and our Board of Directors' continuing determination that the dividend program and the declaration of
dividends thereunder are in the best interests of our stockholders and are in compliance with all laws and agreements of