NVIDIA 2013 Annual Report Download - page 231
Download and view the complete annual report
Please find page 231 of the 2013 NVIDIA annual report below. You can navigate through the pages in the report by either clicking on the pages listed below, or by using the keyword search tool below to find specific information within the annual report.-
 1
1 -
2
-
3
-
4
-
5
-
6
-
7
-
8
-
9
-
10
-
11
-
12
-
13
-
14
-
15
-
16
-
17
-
18
-
19
-
20
-
21
-
22
-
23
-
24
-
25
-
26
-
27
-
28
-
29
-
30
-
31
-
32
-
33
-
34
-
35
-
36
-
37
-
38
-
39
-
40
-
41
-
42
-
43
-
44
-
45
-
46
-
47
-
48
-
49
-
50
-
51
-
52
-
53
-
54
-
55
-
56
-
57
-
58
-
59
-
60
-
61
-
62
-
63
-
64
-
65
-
66
-
67
-
68
-
69
-
70
-
71
-
72
-
73
-
74
-
75
-
76
-
77
-
78
-
79
-
80
-
81
-
82
-
83
-
84
-
85
-
86
-
87
-
88
-
89
-
90
-
91
-
92
-
93
-
94
-
95
-
96
-
97
-
98
-
99
-
100
-
101
-
102
-
103
-
104
-
105
-
106
-
107
-
108
-
109
-
110
-
111
-
112
-
113
-
114
-
115
-
116
-
117
-
118
-
119
-
120
-
121
-
122
-
123
-
124
-
125
-
126
-
127
-
128
-
129
-
130
-
131
-
132
-
133
-
134
-
135
-
136
-
137
-
138
-
139
-
140
-
141
-
142
-
143
-
144
-
145
-
146
-
147
-
148
-
149
-
150
-
151
-
152
-
153
-
154
-
155
-
156
-
157
-
158
-
159
-
160
-
161
-
162
-
163
-
164
-
165
-
166
-
167
-
168
-
169
-
170
-
171
-
172
-
173
-
174
-
175
-
176
-
177
-
178
-
179
-
180
-
181
-
182
-
183
-
184
-
185
-
186
-
187
-
188
-
189
-
190
-
191
-
192
-
193
-
194
-
195
-
196
-
197
-
198
-
199
-
200
-
201
-
202
-
203
-
204
-
205
-
206
-
207
-
208
-
209
-
210
-
211
-
212
-
213
-
214
-
215
-
216
-
217
-
218
-
219
-
220
-
 221
221 -
 222
222 -
 223
223 -
 224
224 -
 225
225 -
 226
226 -
 227
227 -
 228
228 -
 229
229 -
 230
230 -
 231
231 -
 232
232 -
 233
233 -
 234
234 -
 235
235 -
 236
236 -
 237
237 -
 238
238 -
 239
239 -
 240
240 -
 241
241 -
242
-
243
-
244
-
245
-
246
-
247
-
248
-
249
-
250
-
251
-
252
-
253
-
254
-
255
-
256
-
257
-
258
-
259
-
260
-
261
-
262
-
263
-
264
 |
 |

NVIDIA CORPORATION AND SUBSIDIARIES
NOTES TO THE CONSOLIDATED FINANCIAL STATEMENTS
(Continued)
87
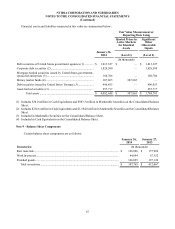
Financial assets and liabilities measured at fair value are summarized below:
Fair Value Measurement at
Reporting Date Using
Quoted Prices in
Active Markets
for Identical
Assets
Significant
Other
Observable
Inputs
January 26,
2014 (Level 1) (Level 2)
(In thousands)
Debt securities of United States government agencies (1) ............ $ 1,013,327 $ — $ 1,013,327
Corporate debt securities (2).......................................................... 1,828,580 — 1,828,580
Mortgage backed securities issued by United States government-
sponsored enterprises (3) ............................................................... 188,706 — 188,706
Money market funds (4)................................................................. 307,865 307,865 —
Debt securities issued by United States Treasury (3)..................... 496,453 — 496,453
Asset-backed securities (3) ............................................................ 257,717 — 257,717
Total assets......................................................................... $ 4,092,648 $ 307,865 $ 3,784,783
(1) Includes $30.0 million in Cash Equivalents and $983.3 million in Marketable Securities on the Consolidated Balance
Sheet.
(2) Includes $234.6 million in Cash Equivalents and $1,594.0 million in Marketable Securities on the Consolidated Balance
Sheet.
(3) Included in Marketable Securities on the Consolidated Balance Sheet.
(4) Included in Cash Equivalents on the Consolidated Balance Sheet.
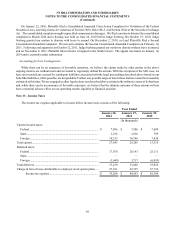
Note 9 - Balance Sheet Components
Certain balance sheet components are as follows:
January 26,
2014 January 27,
2013
Inventories: (In thousands)
Raw materials................................................................................................................... $ 126,896 $ 157,989
Work in-process................................................................................................................ 94,844 67,352
Finished goods.................................................................................................................. 166,025 187,126
Total inventories.......................................................................................................... $ 387,765 $ 412,467