Foot Locker 2004 Annual Report Download - page 70
Download and view the complete annual report
Please find page 70 of the 2004 Foot Locker annual report below. You can navigate through the pages in the report by either clicking on the pages listed below, or by using the keyword search tool below to find specific information within the annual report.-
 1
1 -
2
-
3
-
4
-
5
-
6
-
7
-
8
-
9
-
10
-
11
-
12
-
13
-
14
-
15
-
16
-
17
-
18
-
19
-
20
-
21
-
22
-
23
-
24
-
25
-
26
-
27
-
28
-
29
-
30
-
31
-
32
-
33
-
34
-
35
-
36
-
37
-
38
-
39
-
40
-
41
-
42
-
43
-
44
-
45
-
46
-
47
-
48
-
49
-
50
-
51
-
52
-
53
-
54
-
55
-
56
-
57
-
58
-
59
-
 60
60 -
 61
61 -
 62
62 -
 63
63 -
 64
64 -
 65
65 -
 66
66 -
 67
67 -
 68
68 -
 69
69 -
 70
70 -
 71
71 -
 72
72 -
 73
73 -
 74
74 -
 75
75 -
 76
76 -
 77
77 -
 78
78 -
 79
79 -
 80
80 -
81
-
82
-
83
-
84
-
85
-
86
-
87
-
88
 |
 |

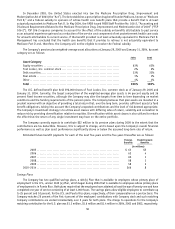
27 Quarterly Results (Unaudited)
1
st
Q2
nd
Q3
rd
Q4
th
Q Year
(in millions, except per share amounts)
Sales
2004 .............................................. $1,186 1,268 1,366 1,535 5,355
2003 .............................................. 1,128 1,123 1,194 1,334 4,779
Gross margin
(a)
2004 .............................................. $ 361 369 426 477 1,633
2003 .............................................. 346 332 390 414 1,482
Operating profit
(b)
2004 .............................................. $ 78 61 117 133 389
2003 .............................................. 67 59 102 114 342
Income from continuing operations
2004 .............................................. $ 47 45 74 89 255
2003 .............................................. 39 37 62 71 209
Net income
2004 .............................................. $ 48 82 74 89 293
2003 .............................................. 38 36 62 71 207
Basic earnings per share:
2004
Income from continuing operations............. $ 0.33 0.30 0.47 0.58 1.69
Income from discontinued operations........... — 0.25 — — 0.25
Net income ..................................... 0.33 0.55 0.47 0.58 1.94
2003
Income from continuing operations............. $ 0.28 0.26 0.43 0.50 1.47
Loss from discontinued operations .............. — (0.01) — — (0.01)
Cumulative effect of accounting change
(c)
..... (0.01) ————
Net income ..................................... 0.27 0.25 0.43 0.50 1.46
Diluted earnings per share:
2004
Income from continuing operations............. $ 0.31 0.29 0.47 0.57 1.64
Income from discontinued operations........... — 0.24 — — 0.24
Net income ..................................... 0.31 0.53 0.47 0.57 1.88
2003
Income from continuing operations............. $ 0.27 0.25 0.41 0.47 1.40
Loss from discontinued operations .............. — (0.01) — — (0.01)
Cumulative effect of accounting change
(c)
..... (0.01) ————
Net income ..................................... 0.26 0.24 0.41 0.47 1.39
(a) Gross margin represents sales less cost of sales. Includes the effects of the reclassification of tenant allowances as deferred credits, which are
amortized as a reduction of rent expense as a component of costs of sales. Costs of sales was reduced by $1 million in each of the first three quarters
of 2004 and 2003 and by $2 million for each of the fourth quarters of 2004 and 2003.
(b) Operating profit represents income from continuing operations before income taxes, interest expense, net and non-operating income.
(c) Cumulative effect of accounting change became further diluted during the second quarter, and therefore is not shown in the year-to-date amount.
54