Foot Locker 2004 Annual Report Download - page 23
Download and view the complete annual report
Please find page 23 of the 2004 Foot Locker annual report below. You can navigate through the pages in the report by either clicking on the pages listed below, or by using the keyword search tool below to find specific information within the annual report.2004 compared with 2003
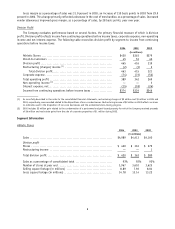
Athletic Stores sales of $4,989 million increased 13.1 percent in 2004, as compared with $4,413 million in 2003.
Excluding the effect of foreign currency fluctuations, primarily related to the euro, sales from athletic store formats
increased 10.6 percent in 2004. This increase was primarily driven by incremental sales related to the acquisition of the
349 Footaction stores in May 2004 totaling $332 million and the sales of the 11 stores acquired in the Republic of Ireland
amounting to $5 million. The balance of the increase primarily reflects new store growth. Total Athletic Stores comparable-
store sales increased by 1.0 percent in 2004.
The Company benefited from continued exclusive offerings from its primary suppliers, gaining access to greater
amounts of marquee products, and a developing trend towards higher priced technical footwear.
Division profit from Athletic Stores increased by 15.7 percent to $420 million in 2004 from $363 million in 2003.
Division profit, as a percentage of sales, increased to 8.4 percent in 2004 from 8.2 percent in 2003. The increase in 2004
was primarily driven by the overall improvement in the selling, general and administrative (“SG&A”) rate as a result of
better expense control. SG&A, as a percentage of sales, declined to 18.8 percent in 2004, as compared with 19.1 percent
in the prior year. Operating performance improved in all of the formats that comprised the Athletic Stores segment.
European operations improved as compared with the prior year, despite a more promotional environment. Additionally,
Champs Sports and Lady Foot Locker improved considerably during 2004. Lady Foot Locker benefited from its modified
merchandise assortment. For the year ended January 29, 2005, the Footaction format negatively affected division profit
by 80 basis points. This was primarily the result of a lower gross margin rate as compared with the Athletic Stores segment
largely related to higher occupancy costs as compared with the Athletic Stores segment as a whole.
2003 compared with 2002
Athletic Stores sales of $4,413 million increased 6.1 percent in 2003, as compared with $4,160 million in 2002.
Excluding the effect of foreign currency fluctuations, primarily related to the euro, sales from athletic store formats
increased 1.9 percent in 2003, driven by the Company’s new store opening program, particularly in Foot Locker Europe
and Foot Locker Australia. Foot Locker Europe and Foot Locker Australia also continued to generate solid comparable-store
sales increases. Total Athletic Stores comparable-store sales decreased by 0.9 percent in 2003.
Footwear sales in the U.S. were led by the classic category. Consumer demand for “retro” fashioned athletic footwear
was also a primary driver of sales throughout 2003. The Company also benefited from exclusive offerings from its primary
suppliers, such as the Nike 20 pack line in the latter part of 2003. Sales of private label and licensed product
also contributed to the increase in sales, as consumer interest began to show improvement with the strengthening of
the economy.
Comparable-store sales at Kids Foot Locker continuously improved since its realignment under the Foot Locker U.S.
management team in 2002. Kids Foot Locker’s sales significantly improved during the fourth quarter of 2003, nearly
reaching double-digit comparable-store sales increases. Lady Foot Locker sales remained essentially unchanged in 2003
versus the prior year as this business continued to modify its merchandising mix to better suit its target customers. The
Company closed a number of underperforming stores, focused on remodeling and relocating numerous stores, and changed
its merchandise assortment.
Division profit from Athletic Stores increased by 30.1 percent to $363 million in 2003 from $279 million in 2002.
Division profit as a percentage of sales increased to 8.2 percent in 2003 from 6.7 percent in 2002. The increase in 2003
was primarily driven by the overall improvement in the gross margin rate as a result of better merchandise purchasing
as well as increased vendor allowances that contributed 30 basis points to the overall improvement. Additionally, during
2002 the Company recorded $7 million of impairment charges for the Kids Foot Locker and Lady Foot Locker formats.
Operating performance improved in the U.S. Foot Locker, Kids Foot Locker and international formats as compared with
the prior year. Champs Sports and Lady Foot Locker remained relatively flat as compared with 2002. However, for the second
half of 2003 the operating results of the Lady Foot Locker format improved considerably, compared with the corresponding
prior year period.
7


