Foot Locker 2004 Annual Report Download - page 3
Download and view the complete annual report
Please find page 3 of the 2004 Foot Locker annual report below. You can navigate through the pages in the report by either clicking on the pages listed below, or by using the keyword search tool below to find specific information within the annual report.-
 1
1 -
 2
2 -
 3
3 -
 4
4 -
 5
5 -
 6
6 -
 7
7 -
 8
8 -
 9
9 -
 10
10 -
 11
11 -
 12
12 -
 13
13 -
 14
14 -
15
-
16
-
17
-
18
-
19
-
20
-
21
-
22
-
23
-
24
-
25
-
26
-
27
-
28
-
29
-
30
-
31
-
32
-
33
-
34
-
35
-
36
-
37
-
38
-
39
-
40
-
41
-
42
-
43
-
44
-
45
-
46
-
47
-
48
-
49
-
50
-
51
-
52
-
53
-
54
-
55
-
56
-
57
-
58
-
59
-
60
-
61
-
62
-
63
-
64
-
65
-
66
-
67
-
68
-
69
-
70
-
71
-
72
-
73
-
74
-
75
-
76
-
77
-
78
-
79
-
80
-
81
-
82
-
83
-
84
-
85
-
86
-
87
-
88
 |
 |

1
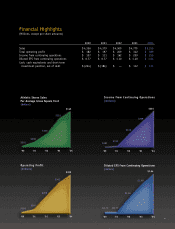
Athletic Stores Sales
Per Average Gross Square Foot
(dollars)
Income from Continuing Operations
(millions)
$316
$306
$301
$335
$345
Operating Profit
(millions)
Diluted EPS from Continuing Operations
(dollars)
$269
$197
$182
$342
$389
$162
$111
$209
$255
$1.10
$0.77
$0.77
$1.40
$1.64
$107
Financial Highlights
(Millions, except per share amounts)
2000 2001 2002 2003 2004
Sales $ 4,356 $ 4,379 $4,509 $ 4,779 $ 5,355
Total operating profit $ 182 $ 197 $ 269 $ 342 $ 389
Income from continuing operations $ 107 $ 111 $ 162 $ 209 $ 255
Diluted EPS from continuing operations $ 0.77 $ 0.77 $ 1.10 $ 1.40 $ 1.64
Cash, cash equivalents and short-term
investment position, net of debt $ (204) $ (184) $ — $ 112 $ 131
‘00 ‘01 ‘02 ‘03 ‘04 ‘00 ‘01 ‘02 ‘03 ‘04
‘00 ‘01 ‘02 ‘03 ‘04 ‘00 ‘01 ‘02 ‘03 ‘04