Foot Locker 2004 Annual Report Download - page 52
Download and view the complete annual report
Please find page 52 of the 2004 Foot Locker annual report below. You can navigate through the pages in the report by either clicking on the pages listed below, or by using the keyword search tool below to find specific information within the annual report.-
 1
1 -
2
-
3
-
4
-
5
-
6
-
7
-
8
-
9
-
10
-
11
-
12
-
13
-
14
-
15
-
16
-
17
-
18
-
19
-
20
-
21
-
22
-
23
-
24
-
25
-
26
-
27
-
28
-
29
-
30
-
31
-
32
-
33
-
34
-
35
-
36
-
37
-
38
-
39
-
40
-
41
-
 42
42 -
 43
43 -
 44
44 -
 45
45 -
 46
46 -
 47
47 -
 48
48 -
 49
49 -
 50
50 -
 51
51 -
 52
52 -
 53
53 -
 54
54 -
 55
55 -
 56
56 -
 57
57 -
 58
58 -
 59
59 -
 60
60 -
 61
61 -
 62
62 -
63
-
64
-
65
-
66
-
67
-
68
-
69
-
70
-
71
-
72
-
73
-
74
-
75
-
76
-
77
-
78
-
79
-
80
-
81
-
82
-
83
-
84
-
85
-
86
-
87
-
88
 |
 |

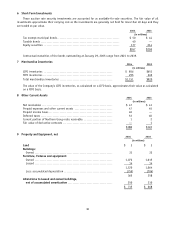
6 Short-Term Investments
These auction rate security investments are accounted for as available-for-sale securities. The fair value of all
investments approximate their carrying cost as the investments are generally not held for more than 49 days and they
are traded at par value.
2004 2003
(in millions)
Tax exempt municipal bonds ..................................................... $ 50 $ 44
Taxable bonds ................................................................... 40 —
Equity securities ................................................................ 177 214
$267 $258
Contractual maturities of the bonds outstanding at January 29, 2005 range from 2021 to 2039.
7 Merchandise Inventories 2004 2003
(in millions)
LIFO inventories .......................................................... $ 856 $651
FIFO inventories ........................................................... 295 269
Total merchandise inventories ............................................. $1,151 $920
The value of the Company’s LIFO inventories, as calculated on a LIFO basis, approximates their value as calculated
on a FIFO basis.
8 Other Current Assets 2004 2003
(in millions)
Net receivables ............................................................ $ 47 $ 41
Prepaid expenses and other current assets ................................ 47 45
Prepaid income taxes ...................................................... 40 —
Deferred taxes ............................................................. 53 60
Current portion of Northern Group note receivable ........................ 1 2
Fair value of derivative contracts .......................................... — 1
$188 $149
9 Property and Equipment, net 2004 2003
(in millions)
Land $3 $3
Buildings:
Owned .................................................................. 31 32
Furniture, fixtures and equipment:
Owned .................................................................. 1,072 1,015
Leased .................................................................. 14 14
1,120 1,064
Less: accumulated depreciation ......................................... (755) (706)
365 358
Alterations to leased and owned buildings,
net of accumulated amortization ...................................... 350 310
$ 715 $ 668
36