Foot Locker 2004 Annual Report Download - page 44
Download and view the complete annual report
Please find page 44 of the 2004 Foot Locker annual report below. You can navigate through the pages in the report by either clicking on the pages listed below, or by using the keyword search tool below to find specific information within the annual report.-
 1
1 -
2
-
3
-
4
-
5
-
6
-
7
-
8
-
9
-
10
-
11
-
12
-
13
-
14
-
15
-
16
-
17
-
18
-
19
-
20
-
21
-
22
-
23
-
24
-
25
-
26
-
27
-
28
-
29
-
30
-
31
-
32
-
33
-
 34
34 -
 35
35 -
 36
36 -
 37
37 -
 38
38 -
 39
39 -
 40
40 -
 41
41 -
 42
42 -
 43
43 -
 44
44 -
 45
45 -
 46
46 -
 47
47 -
 48
48 -
 49
49 -
 50
50 -
 51
51 -
 52
52 -
 53
53 -
 54
54 -
55
-
56
-
57
-
58
-
59
-
60
-
61
-
62
-
63
-
64
-
65
-
66
-
67
-
68
-
69
-
70
-
71
-
72
-
73
-
74
-
75
-
76
-
77
-
78
-
79
-
80
-
81
-
82
-
83
-
84
-
85
-
86
-
87
-
88
 |
 |

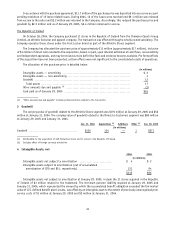
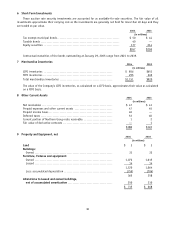
Catalog Costs
Catalog costs, which primarily comprise paper, printing, and postage, are capitalized and amortized over the expected
customer response period to each catalog, generally 90 days. Cooperative reimbursements earned for the promotion of
certain products is agreed upon with vendors and is recorded in the same period as the associated catalog expenses are
amortized. Prepaid catalog costs totaled $3.5 million and $2.9 million at January 29, 2005 and January 31, 2004,
respectively.
Catalog costs, which are included as a component of selling, general and administrative expenses, net of
reimbursements for cooperative reimbursements, were as follows:
2004 2003 2002
(in millions)
Catalog costs ............................................... $50.3 $42.4 $41.9
Cooperative reimbursements ................................ (2.9) (3.5) (2.9)
Net catalog expense ........................................ $47.4 $38.9 $39.0
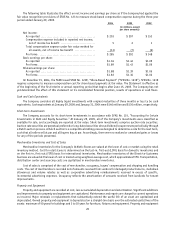
Earnings Per Share
Basic earnings per share is computed as net income divided by the weighted-average number of common shares
outstanding for the period. Diluted earnings per share reflects the potential dilution that could occur from common shares
issuable through stock-based compensation including stock options and the conversion of convertible long-term debt.
The following table reconciles the numerator and denominator used to compute basic and diluted earnings per share for
continuing operations.
2004 2003 2002
(in millions)
Income from continuing operations......................... $ 255 $ 209 $ 162
Effect of Dilution:
Convertible debt ............................................ 2 5 5
Income from continuing operations assuming dilution ...... $ 257 $ 214 $ 167
Weighted-average common shares outstanding ............. 150.9 141.6 140.7
Effect of Dilution:
Stock options and awards ................................... 3.0 1.8 0.6
Convertible debt ............................................ 3.2 9.5 9.5
Weighted-average common shares outstanding
assuming dilution ........................................ 157.1 152.9 150.8
Options to purchase 1.5 million, 3.6 million and 6.8 million shares of common stock as of January 29, 2005,
January 31, 2004 and February 1, 2003, respectively, were not included in the computations because the exercise price
of the options was greater than the average market price of the common shares and, therefore, the effect of their inclusion
would be antidilutive.
Stock-Based Compensation
The Company accounts for stock-based compensation plans in accordance with the intrinsic-value based method
permitted by SFAS No. 123, “Accounting for Stock-Based Compensation” (“SFAS No. 123”) which has not resulted in
compensation cost for stock options and shares purchased under employee stock purchase plans. No compensation
expense for employee stock options is reflected in net income, as all stock options granted under those plans had an
exercise price not less than the quoted market price at the date of grant. The market value at date of grant of restricted
stock is recorded as compensation expense over the period of vesting.
28