Foot Locker 2004 Annual Report Download - page 45
Download and view the complete annual report
Please find page 45 of the 2004 Foot Locker annual report below. You can navigate through the pages in the report by either clicking on the pages listed below, or by using the keyword search tool below to find specific information within the annual report.-
 1
1 -
2
-
3
-
4
-
5
-
6
-
7
-
8
-
9
-
10
-
11
-
12
-
13
-
14
-
15
-
16
-
17
-
18
-
19
-
20
-
21
-
22
-
23
-
24
-
25
-
26
-
27
-
28
-
29
-
30
-
31
-
32
-
33
-
34
-
 35
35 -
 36
36 -
 37
37 -
 38
38 -
 39
39 -
 40
40 -
 41
41 -
 42
42 -
 43
43 -
 44
44 -
 45
45 -
 46
46 -
 47
47 -
 48
48 -
 49
49 -
 50
50 -
 51
51 -
 52
52 -
 53
53 -
 54
54 -
 55
55 -
56
-
57
-
58
-
59
-
60
-
61
-
62
-
63
-
64
-
65
-
66
-
67
-
68
-
69
-
70
-
71
-
72
-
73
-
74
-
75
-
76
-
77
-
78
-
79
-
80
-
81
-
82
-
83
-
84
-
85
-
86
-
87
-
88
 |
 |

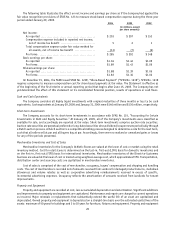
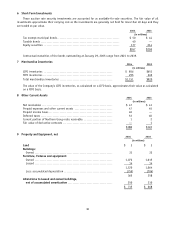
The following table illustrates the effect on net income and earnings per share as if the Company had applied the
fair value recognition provisions of SFAS No. 123 to measure stock-based compensation expense during the three-year
period ended January 29, 2005.
2004 2003 2002
(in millions, except
per share amounts)
Net income:
As reported .............................................. $ 293 $ 207 $ 153
Compensation expense included in reported net income,
net of income tax benefit ............................. 5 2 1
Total compensation expense under fair value method for
all awards, net of income tax benefit ................. (13) (7) (6)
Pro forma ................................................ $ 285 $ 202 $ 148
Basic earnings per share:
As reported .............................................. $1.94 $1.46 $1.09
Pro forma ................................................ $1.89 $1.43 $1.05
Diluted earnings per share:
As reported .............................................. $1.88 $1.39 $1.05
Pro forma ................................................ $1.83 $1.36 $1.02
On December 15, 2004, the FASB issued SFAS No. 123R, “Share-Based Payment” (“SFAS No. 123R”). SFAS No. 123R
requires companies to measure compensation cost for share-based payments at fair value. The Statement is effective as
of the beginning of the first interim or annual reporting period that begins after June 15, 2005. The Company has not
yet determined the effect of this statement on its consolidated financial position, results of operations or cash flows.
Cash and Cash Equivalents
The Company considers all highly liquid investments with original maturities of three months or less to be cash
equivalents. Cash equivalents at January 29, 2005 and January 31, 2004 were $140 million and $130 million, respectively.
Short-Term Investments
The Company accounts for its short-term investments in accordance with SFAS No. 115, “Accounting for Certain
Investments in Debt and Equity Securities.” At January 29, 2005, all of the Company’s investments were classified as
available for sale, and accordingly are reported at fair value. Short-term investments comprise auction rate securities.
Auction rate securities are perpetual preferred or long-dated securities whose dividend/coupon resets periodically through
a Dutch auction process. A Dutch auction is a competitive bidding process designed to determine a rate for the next term,
such that all sellers sell at par and all buyers buy at par. Accordingly, there were no realized or unrealized gains or losses
for any of the periods presented.
Merchandise Inventories and Cost of Sales
Merchandise inventories for the Company’s Athletic Stores are valued at the lower of cost or market using the retail
inventory method. Cost for retail stores is determined on the last-in, first-out (LIFO) basis for domestic inventories and
on the first-in, first-out (FIFO) basis for international inventories. Merchandise inventories of the Direct-to-Customers
business are valued at the lower of cost or market using weighted-average cost, which approximates FIFO. Transportation,
distribution center and sourcing costs are capitalized in merchandise inventories.
Cost of sales is comprised of the cost of merchandise, occupancy, buyers’ compensation and shipping and handling
costs. The cost of merchandise is recorded net of amounts received from vendors for damaged product returns, markdown
allowances and volume rebates as well as cooperative advertising reimbursements received in excess of specific,
incremental advertising expenses. Occupancy reflects the amortization of amounts received from landlords for tenant
improvements.
Property and Equipment
Property and equipment are recorded at cost, less accumulated depreciation and amortization. Significant additions
and improvements to property and equipment are capitalized. Maintenance and repairs are charged to current operations
as incurred. Major renewals or replacements that substantially extend the useful life of an asset are capitalized and
depreciated. Owned property and equipment is depreciated on a straight-line basis over the estimated useful lives of the
assets: maximum of 50 years for buildings and 3 to 10 years for furniture, fixtures and equipment. Property and equipment
29