Foot Locker 2004 Annual Report Download - page 64
Download and view the complete annual report
Please find page 64 of the 2004 Foot Locker annual report below. You can navigate through the pages in the report by either clicking on the pages listed below, or by using the keyword search tool below to find specific information within the annual report.-
 1
1 -
2
-
3
-
4
-
5
-
6
-
7
-
8
-
9
-
10
-
11
-
12
-
13
-
14
-
15
-
16
-
17
-
18
-
19
-
20
-
21
-
22
-
23
-
24
-
25
-
26
-
27
-
28
-
29
-
30
-
31
-
32
-
33
-
34
-
35
-
36
-
37
-
38
-
39
-
40
-
41
-
42
-
43
-
44
-
45
-
46
-
47
-
48
-
49
-
50
-
51
-
52
-
53
-
 54
54 -
 55
55 -
 56
56 -
 57
57 -
 58
58 -
 59
59 -
 60
60 -
 61
61 -
 62
62 -
 63
63 -
 64
64 -
 65
65 -
 66
66 -
 67
67 -
 68
68 -
 69
69 -
 70
70 -
 71
71 -
 72
72 -
 73
73 -
 74
74 -
75
-
76
-
77
-
78
-
79
-
80
-
81
-
82
-
83
-
84
-
85
-
86
-
87
-
88
 |
 |

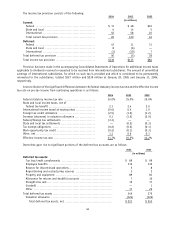
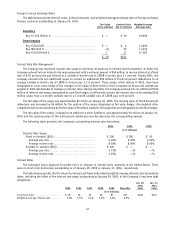
Fair Value of Financial Instruments
The carrying value and estimated fair value of long-term debt was $351 million and $368 million, respectively, at
January 29, 2005 and $321 million and $435 million, respectively, at January 31, 2004. The carrying value and estimated
fair value of long-term investments and notes receivable was $32 million and $33 million, respectively, at January 29,
2005, and $31 million and $33 million, respectively, at January 31, 2004. The carrying values of cash and cash equivalents,
short-term investments and other current receivables and payables approximate their fair value.
Business Risk
The retailing business is highly competitive. Price, quality and selection of merchandise, reputation, store location,
advertising and customer service are important competitive factors in the Company’s business. The Company operates in
18 countries and purchases merchandise from hundreds of vendors worldwide. In 2004, the Company purchased
approximately 45 percent of its athletic merchandise from one major vendor and approximately 13 percent from another
major vendor. The Company generally considers all vendor relations to be satisfactory.
Included in the Company’s Consolidated Balance Sheet as of January 29, 2005, are the net assets of the Company’s
European operations totaling $415 million, which are located in 14 countries, 10 of which have adopted the euro as their
functional currency.
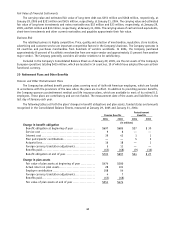
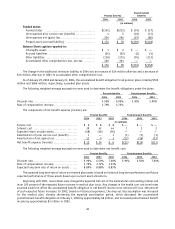
20 Retirement Plans and Other Benefits
Pension and Other Postretirement Plans
The Company has defined benefit pension plans covering most of its North American employees, which are funded
in accordance with the provisions of the laws where the plans are in effect. In addition to providing pension benefits,
the Company sponsors postretirement medical and life insurance plans, which are available to most of its retired U.S.
employees. These plans are contributory and are not funded. The measurement date of the assets and liabilities is the
last day of January each year.
The following tables set forth the plans’ changes in benefit obligations and plan assets, funded status and amounts
recognized in the Consolidated Balance Sheets, measured at January 29, 2005 and January 31, 2004:
Pension Benefits
Postretirement
Benefits
2004 2003 2004 2003
(in millions)
Change in benefit obligation
Benefit obligation at beginning of year .................. $697 $685 $27 $ 30
Service cost .............................................. 9 8 — —
Interest cost ............................................. 39 43 1 1
Plan participants’ contributions .......................... — — 5 5
Actuarial loss............................................. 16 18 — 1
Foreign currency translation adjustments................. 5 11 — —
Benefits paid ............................................. (63) (68) (9) (10)
Benefit obligation at end of year ......................... $703 $697 $24 $ 27
Change in plan assets
Fair value of plan assets at beginning of year ............ $474 $380
Actual return on plan assets.............................. 28 101
Employer contribution.................................... 108 54
Foreign currency translation adjustments................. 4 7
Benefits paid ............................................. (63) (68)
Fair value of plan assets at end of year ................... $551 $474
48