Foot Locker 2004 Annual Report Download - page 68
Download and view the complete annual report
Please find page 68 of the 2004 Foot Locker annual report below. You can navigate through the pages in the report by either clicking on the pages listed below, or by using the keyword search tool below to find specific information within the annual report.-
 1
1 -
2
-
3
-
4
-
5
-
6
-
7
-
8
-
9
-
10
-
11
-
12
-
13
-
14
-
15
-
16
-
17
-
18
-
19
-
20
-
21
-
22
-
23
-
24
-
25
-
26
-
27
-
28
-
29
-
30
-
31
-
32
-
33
-
34
-
35
-
36
-
37
-
38
-
39
-
40
-
41
-
42
-
43
-
44
-
45
-
46
-
47
-
48
-
49
-
50
-
51
-
52
-
53
-
54
-
55
-
56
-
57
-
 58
58 -
 59
59 -
 60
60 -
 61
61 -
 62
62 -
 63
63 -
 64
64 -
 65
65 -
 66
66 -
 67
67 -
 68
68 -
 69
69 -
 70
70 -
 71
71 -
 72
72 -
 73
73 -
 74
74 -
 75
75 -
 76
76 -
 77
77 -
 78
78 -
79
-
80
-
81
-
82
-
83
-
84
-
85
-
86
-
87
-
88
 |
 |

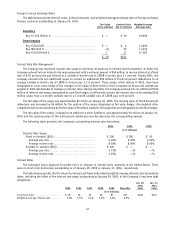
The Black-Scholes option valuation model was developed for estimating the fair value of traded options that have
no vesting restrictions and are fully transferable. Because option valuation models require the use of subjective
assumptions, changes in these assumptions can materially affect the fair value of the options, and because the Company’s
options do not have the characteristics of traded options, the option valuation models do not necessarily provide a reliable
measure of the fair value of its options.
The information set forth in the following table covers options granted under the Company’s stock option plans:
2004 2003 2002
Number
of
Shares
Weighted-
Average
Exercise
Price
Number
of
Shares
Weighted-
Average
Exercise
Price
Number
of
Shares
Weighted-
Average
Exercise
Price
(in thousands, except prices per share)
Options outstanding at beginning of year .. . 6,886 $14.73 7,676 $15.18 7,557 $14.63
Granted ..................................... 1,183 $25.20 1,439 $10.81 1,640 $15.72
Exercised .................................... 1,853 $14.43 1,830 $12.50 783 $ 6.67
Expired or canceled ......................... 307 $19.13 399 $19.55 738 $19.80
Options outstanding at end of year ......... 5,909 $16.69 6,886 $14.73 7,676 $15.18
Options exercisable at end of year .......... 3,441 $15.34 4,075 $15.99 4,481 $15.94
Options available for future grant at
end of year ............................... 7,464 8,780 6,739
The following table summarizes information about stock options outstanding and exercisable at January 29, 2005:
Options Outstanding Options Exercisable
Range of Exercise Prices Shares
Weighted-
Average
Remaining
Contractual
Life
Weighted-
Average
Exercise
Price Shares
Weighted-
Average
Exercise
Price
(in thousands, except prices per share)
$ 4.53 to $10.75.................................. 1,230 7.7 $ 9.85 483 $ 9.25
$10.78 to $15.75 ................................. 1,529 5.9 12.53 1,487 12.51
$15.85 to $21.88 ................................. 1,318 7.0 16.55 772 16.70
$22.19 to $28.13 ................................. 1,832 6.7 24.84 699 24.09
$ 4.53 to $28.13.................................. 5,909 6.8 $16.69 3,441 $15.34
22 Restricted Stock
Restricted shares of the Company’s common stock may be awarded to certain officers and key employees of the
Company. There were 330,000, 845,000 and 90,000 restricted shares of common stock granted in 2004, 2003 and 2002,
respectively. In 2004, 72,005 restricted stock units were granted to certain executives located outside of the United
States; each restricted unit represents the right to receive one share of the Company’s common stock provided that the
vesting conditions are satisfied. The market values of the shares and units at the date of grant amounted to $10.2 million
in 2004, $9.8 million in 2003 and $1.3 million in 2002. The market values are recorded within shareholders’ equity and
are amortized as compensation expense over the related vesting periods. These awards fully vest after the passage of a
restriction period, generally three years, except for certain grants in 2004 and 2003. The Company granted 75,000 shares
of restricted stock in 2004, which vest over 13 months and in 2003 granted 200,000 shares of restricted stock that vested
50 percent one year following the date of grant and 50 percent will vest two years from the date of grant. During 2004,
2003 and 2002, respectively, 30,000, 80,000 and 60,000 restricted shares were forfeited. The deferred compensation
balance, reflected as a reduction to shareholders’ equity, was $9.0 million, $7.1 million and $2.4 million as of January 29,
2005, January 31, 2004 and February 1, 2003, respectively. The Company recorded compensation expense related to
restricted shares, net of forfeitures, of $8.0 million in 2004, $4.1 million in 2003 and $1.9 million in 2002.
52