Foot Locker 2004 Annual Report Download - page 24
Download and view the complete annual report
Please find page 24 of the 2004 Foot Locker annual report below. You can navigate through the pages in the report by either clicking on the pages listed below, or by using the keyword search tool below to find specific information within the annual report.-
 1
1 -
2
-
3
-
4
-
5
-
6
-
7
-
8
-
9
-
10
-
11
-
12
-
13
-
 14
14 -
 15
15 -
 16
16 -
 17
17 -
 18
18 -
 19
19 -
 20
20 -
 21
21 -
 22
22 -
 23
23 -
 24
24 -
 25
25 -
 26
26 -
 27
27 -
 28
28 -
 29
29 -
 30
30 -
 31
31 -
 32
32 -
 33
33 -
 34
34 -
35
-
36
-
37
-
38
-
39
-
40
-
41
-
42
-
43
-
44
-
45
-
46
-
47
-
48
-
49
-
50
-
51
-
52
-
53
-
54
-
55
-
56
-
57
-
58
-
59
-
60
-
61
-
62
-
63
-
64
-
65
-
66
-
67
-
68
-
69
-
70
-
71
-
72
-
73
-
74
-
75
-
76
-
77
-
78
-
79
-
80
-
81
-
82
-
83
-
84
-
85
-
86
-
87
-
88
 |
 |

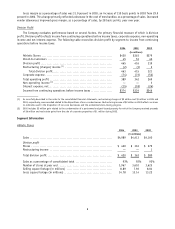
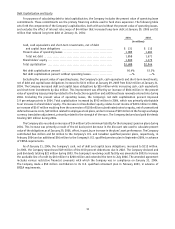
Direct-to-Customers
2004 2003 2002
(in millions)
Sales ....................................................... $366 $366 $349
Division profit .............................................. $ 45 $ 53 $ 40
Sales as a percentage of consolidated total ................ 7% 8% 8%
2004 compared with 2003
Direct-to-Customers sales were $366 million in both 2004 and 2003. The growth of the Internet business continued
to drive sales in 2004. Internet sales increased by 11.0 percent to $212 million from $191 million in 2003. Catalog sales
decreased by 12.0 percent to $154 million in 2004 from $175 million in 2003. Management believes that the decrease
in catalog sales which was substantially offset by the increase in Internet sales resulted as customers continue to browse
and select products through its catalogs, then make their purchases via the Internet. The Company continues to implement
new initiatives to increase this business, including new marketing arrangements and strategic alliances with well-known
third parties. During the fourth quarter of 2004, a new agreement was reached with ESPN whereby the Company manages
the ESPN Shop — an ESPN-branded direct mail catalog and e-commerce destination where fans can purchase athletic
footwear, apparel and equipment.
The Direct-to-Customers business generated division profit of $45 million in 2004, as compared with $53 million in
2003. The decrease in division profit is a result of expanded catalog circulation expenses in 2004. Division profit, as a
percentage of sales, decreased to 12.3 percent from 14.5 percent, however, the Direct-to-Customer business remains more
profitable than the Company’s Athletic Stores segment.
2003 compared with 2002
Direct-to-Customers sales increased 4.9 percent in 2003 to $366 million as compared with $349 million in 2002,
driven by the growth of the Internet business. Internet sales increased by 32.6 percent to $191 million from $144 million
in 2002. Catalog sales declined by 14.6 percent to $175 million in 2003 from $205 million in 2002. During 2003, the
Company extended its agreement with the NFL, entered into new alliance agreements with the NBA and the USOC and
expanded its services through on-line specialty stores with Amazon.com. These agreements generally provide for the
Company to merchandise, fulfill and manage the websites of these strategic partners.
The Direct-to-Customers business generated division profit of $53 million in 2003, as compared with $40 million in
2002. The increase in division profit was primarily due to increased sales. Division profit, as a percentage of sales, increased
to 14.5 percent in 2003 from 11.5 percent in 2002.
Corporate Expense
Corporate expense consists of unallocated general and administrative expenses related to the Company’s corporate
headquarters, centrally managed departments, unallocated insurance and benefit programs, certain foreign exchange
transaction gains and losses, certain depreciation and amortization expenses and other items.
The increase in corporate expense of $1 million in 2004 comprised several items, and primarily included decreased
incentive bonuses of $9 million, offset by increased expenses related to integration costs of $5 million, restricted stock
expense from additional grants of $4 million and costs of $3 million related to the Company’s expanded loyalty program.
Integration costs represent incremental costs directly related to the acquisitions, primarily expenses to re-merchandise
the Footaction stores during the first three months of operations. Depreciation and amortization included in corporate
expense, amounted to $23 million in 2004, $25 million in 2003 and $26 million in 2002. The increase in corporate expense
in 2003 as compared with 2002 was primarily related to increased compensation costs for incentive bonuses and increased
restricted stock expense from additional grants.
8