Foot Locker 2004 Annual Report Download - page 51
Download and view the complete annual report
Please find page 51 of the 2004 Foot Locker annual report below. You can navigate through the pages in the report by either clicking on the pages listed below, or by using the keyword search tool below to find specific information within the annual report.-
 1
1 -
2
-
3
-
4
-
5
-
6
-
7
-
8
-
9
-
10
-
11
-
12
-
13
-
14
-
15
-
16
-
17
-
18
-
19
-
20
-
21
-
22
-
23
-
24
-
25
-
26
-
27
-
28
-
29
-
30
-
31
-
32
-
33
-
34
-
35
-
36
-
37
-
38
-
39
-
40
-
 41
41 -
 42
42 -
 43
43 -
 44
44 -
 45
45 -
 46
46 -
 47
47 -
 48
48 -
 49
49 -
 50
50 -
 51
51 -
 52
52 -
 53
53 -
 54
54 -
 55
55 -
 56
56 -
 57
57 -
 58
58 -
 59
59 -
 60
60 -
 61
61 -
62
-
63
-
64
-
65
-
66
-
67
-
68
-
69
-
70
-
71
-
72
-
73
-
74
-
75
-
76
-
77
-
78
-
79
-
80
-
81
-
82
-
83
-
84
-
85
-
86
-
87
-
88
 |
 |
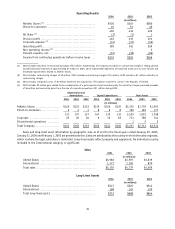
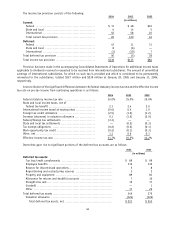
Operating Results
2004 2003 2002
(in millions)
Athletic Stores
(1)
.......................................... $420 $363 $280
Direct-to-Customers ........................................ 45 53 40
465 416 320
All Other
(2)
................................................ (2) (1) 1
Division profit .............................................. 463 415 321
Corporate expense
(3)
...................................... (74) (73) (52)
Operating profit............................................. 389 342 269
Non-operating income
(4)
.................................. — — 3
Interest expense, net ...................................... (15) (18) (26)
Income from continuing operations before income taxes ... $374 $324 $246
(1) 2002 includes reductions in restructuring charges of $1 million. Additionally, the Company recorded non-cash pre-tax charges in selling, general
and administrative expenses of approximately $7 million in 2002, which represented impairment of long-lived assets such as store fixtures and
leasehold improvements related to Athletic Stores.
(2) 2004 includes restructuring charges of $2 million. 2003 includes restructuring charges of $1 million. 2002 includes a $1 million reduction in
restructuring charges.
(3) 2004 includes integration costs of $5 million related to the acquisitions of Footaction and the 11 stores in the Republic of Ireland.
(4) 2002 includes $2 million gain related to the condemnation of a part-owned and part-leased property for which the Company received proceeds
of $6 million and real estate gains from the sale of corporate properties of $1 million during 2002.
Depreciation and
Amortization Capital Expenditures Total Assets
2004 2003 2002 2004 2003 2002 2004 2003 2002
(in millions)
Athletic Stores .................... $126 $123 $123 $139 $126 $124 $2,335 $1,739 $1,591
Direct-to-Customers ............... 5 4 4 8 6 8 190 183 177
131 127 127 147 132 132 2,525 1,922 1,768
Corporate ......................... 23 25 26 9 12 18 711 789 744
Discontinued operations .......... 1 2 2
Total Company .................... $154 $152 $153 $156 $144 $150 $3,237 $2,713 $2,514
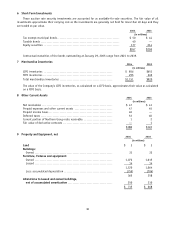
Sales and long-lived asset information by geographic area as of and for the fiscal years ended January 29, 2005,
January 31, 2004 and February 1, 2003 are presented below. Sales are attributed to the country in which the sales originate,
which is where the legal subsidiary is domiciled. Long-lived assets reflect property and equipment. No individual country
included in the International category is significant.
Sales
2004 2003 2002
(in millions)
United States .............................................. $3,982 $3,597 $3,639
International ............................................... 1,373 1,182 870
Total sales ................................................. $5,355 $4,779 $4,509
Long-Lived Assets
2004 2003 2002
(in millions)
United States .............................................. $547 $525 $544
International ............................................... 168 143 120
Total long-lived assets ..................................... $715 $668 $664
35