Food Lion 2012 Annual Report Download - page 93
Download and view the complete annual report
Please find page 93 of the 2012 Food Lion annual report below. You can navigate through the pages in the report by either clicking on the pages listed below, or by using the keyword search tool below to find specific information within the annual report.
DELHAIZE GROUP FINANCIAL STATEMENTS ’12 // 91
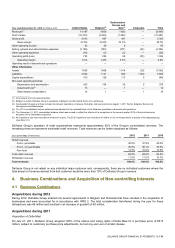
Year ended December 31, 2010 (in millions of €)
United States
Belgium(2)
Southeastern
Europe and
Asia(3)
Corporate
Total
Revenues(1)
14 187
4 800
1 863
—
20 850
Cost of sales
(10 272)
(3 803)
(1 422)
—
(15 497)
Gross profit
3 915
997
441
—
5 353
Gross margin
27.6%
20.8%
23.7%
—
25.7%
Other operating income
43
36
6
—
85
Selling, general and administrative expenses
(3 189)
(795)
(377)
(33)
(4 394)
Other operating expenses
(16)
(2)
(2)
—
(20)
Operating profit (loss)
753
236
68
(33)
1 024
Operating margin
5.3%
4.9%
3.7%
—
4.9%
Operating result of discontinued operations
—
—
—
—
—
Other information
Assets
7 850
1 806
1 014
232
10 902
Liabilities
2 592
1 141
508
1 592
5 833
Capital expenditures
410
128
113
9
660
Non-cash operating activities:
Depreciation and amortization
423
104
39
9
575
Impairment loss(6)
13
—
1
—
14
Share-based compensation
14
1
—
1
16
_______________
(1) All revenues are from external parties.
(2) Belgium includes Delhaize Group’s operations in Belgium and the Grand Duchy of Luxembourg.
(3) Southeastern Europe and Asia includes the Group’s operations in Greece, Romania, Indonesia and since August 1, 2011 Serbia, Bulgaria, Bosnia and
Herzegovina and Montenegro.
(4) The 2011 consolidated income statement was adjusted for the reclassification of the Albanian operations to discontinued operations.
(5) The December 31, 2011 consolidated balance sheet was revised to reflect the effects of the completion in the second quarter 2012 of the purchase price
allocation of the Delta Maxi acquisition.
(6) No impairment loss was recorded or reversed in equity. The 2012 impairment loss includes €16 million on the re-measurement of assets of the disposal group
(see Note 5.3.)
Delhaize Group’s operation of retail supermarkets represents approximately 90% of the Group’s consolidated revenues. The
remaining revenue represents wholesale retail revenues. Total revenues can be further analyzed as follows:
(as a percentage of revenues)
2012
2011
2010
Retail revenues
- Food - perishable
40.0%
37.9%
40.0%
- Food - non-perishable
35.6%
36.1%
35.5%
- Non-food
13.4%
15.0%
13.8%
Total retail revenues
89.0%
89.0%
89.3%
Wholesale revenues
11.0%
11.0%
10.7%
Total revenues
100.0%
100.0%
100.0%
Delhaize Group is not reliant on any individual major customer and, consequently, there are no individual customers where the
total amount of revenue derived from that customer would be more than 10% of Delhaize Group’s revenue.
4. Business Combinations and Acquisition of Non-controlling Interests
4.1 Business Combinations
Acquisitions during 2012
During 2012, Delhaize Group entered into several agreements in Belgium and Romania that have resulted in the acquisition of
businesses and were accounted for in accordance with IFRS 3. The total consideration transferred during the year for these
transactions was €5 million and resulted in an increase of goodwill of €3 million.
Acquisitions during 2011
Acquisition of Delta Maxi
On July 27, 2011, Delhaize Group acquired 100% of the shares and voting rights of Delta Maxi for a purchase price of €615
million, subject to customary purchase price adjustments, but not any earn-out or similar clauses.


