Food Lion 2012 Annual Report Download - page 53
Download and view the complete annual report
Please find page 53 of the 2012 Food Lion annual report below. You can navigate through the pages in the report by either clicking on the pages listed below, or by using the keyword search tool below to find specific information within the annual report.-
 1
1 -
2
-
3
-
4
-
5
-
6
-
7
-
8
-
9
-
10
-
11
-
12
-
13
-
14
-
15
-
16
-
17
-
18
-
19
-
20
-
21
-
22
-
23
-
24
-
25
-
26
-
27
-
28
-
29
-
30
-
31
-
32
-
33
-
34
-
35
-
36
-
37
-
38
-
39
-
40
-
41
-
42
-
 43
43 -
 44
44 -
 45
45 -
 46
46 -
 47
47 -
 48
48 -
 49
49 -
 50
50 -
 51
51 -
 52
52 -
 53
53 -
 54
54 -
 55
55 -
 56
56 -
 57
57 -
 58
58 -
 59
59 -
 60
60 -
 61
61 -
 62
62 -
 63
63 -
64
-
65
-
66
-
67
-
68
-
69
-
70
-
71
-
72
-
73
-
74
-
75
-
76
-
77
-
78
-
79
-
80
-
81
-
82
-
83
-
84
-
85
-
86
-
87
-
88
-
89
-
90
-
91
-
92
-
93
-
94
-
95
-
96
-
97
-
98
-
99
-
100
-
101
-
102
-
103
-
104
-
105
-
106
-
107
-
108
-
109
-
110
-
111
-
112
-
113
-
114
-
115
-
116
-
117
-
118
-
119
-
120
-
121
-
122
-
123
-
124
-
125
-
126
-
127
-
128
-
129
-
130
-
131
-
132
-
133
-
134
-
135
-
136
-
137
-
138
-
139
-
140
-
141
-
142
-
143
-
144
-
145
-
146
-
147
-
148
-
149
-
150
-
151
-
152
-
153
-
154
-
155
-
156
-
157
-
158
-
159
-
160
-
161
-
162
-
163
-
164
-
165
-
166
-
167
-
168
-
169
-
170
-
171
-
172
-
173
-
174
-
175
-
176
 |
 |
DELHAIZE GROUP ANNUAL REPORT ‘12 // 51
When determining a compensation
package, the RNC considers all of
these elements.
In general, these components
can be categorized as either fixed
or variable. The base salary and
other benefits, retirement and post-
employment benefits are considered
fixed. The annual bonus and the dif-
ferent components of the long-term
incentives are considered variable.
Delhaize Group believes that the cur-
rent proportion of fixed versus varia-
ble pay offers its executives the right
incentives to optimize both the short-
term and long-term objectives of the
Company and its shareholders.
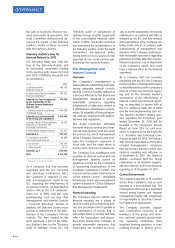
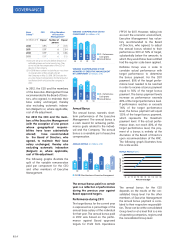
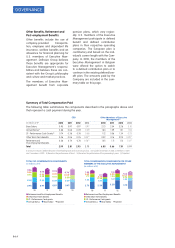
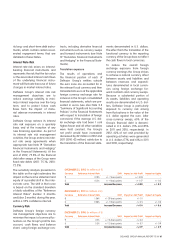
The following graphs illustrate the
proportion of fixed versus variable
compensation for both the CEO and
other members of Executive Man-
agement. These charts reflect base
salary, annual bonus and perfor-
mance cash components granted in
2012.
fixed: 36.3%
variable: 63.7%
FIXED VS VARIABLE
COMPENSATION FOR THE CEO
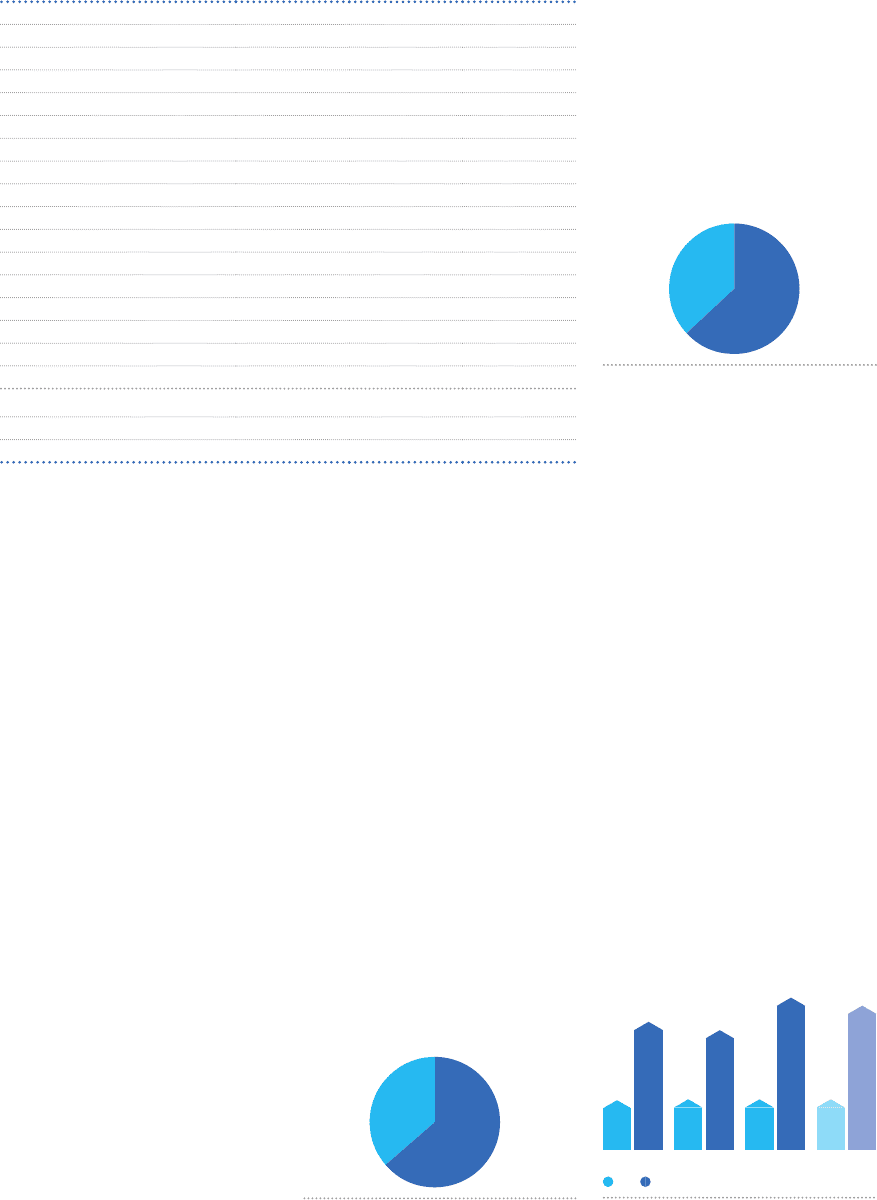
fixed: 36.9%
variable: 63.2%
FIXED VS VARIABLE COMPENSATION FOR
THE OTHER MEMBERS OF EXECUTIVE
MANAGEMENT
The tables used in the following sec-
tions of this report are based on the
actual payments received during
the year and not on the amounts
granted for the year, i.e., 2012
payments include cash received
based on annual bonus earned for
2011 and performance cash grants
received over the performance
period 2009-2011.
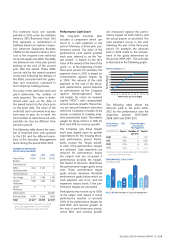
Base Salary
Base salary is a key component of
the compensation package, both on
its own and because annual target
awards and long-term incentive
awards are denominated as per-
centages of base salary.
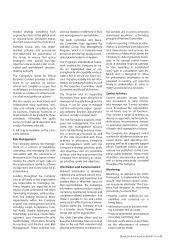
Base salaries are established and
adjusted as a result of an annual
review process. This review process
considers market practices. The fol-
lowing table summarizes base sal-
ary paid to the CEO and the other
members of Executive Management
for the period 2010-2012.
BASE SALARY (in millions of €)
10
0.95
2.73
11
0.97
2.54
0.97
3.28
12
0.97
3.10
13
CEO Other Members of Executive Management
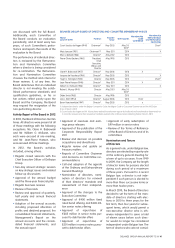
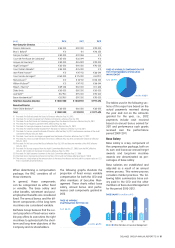
(in €) 2010 2011 2012
Non-Executive Directors
Claire H. Babrowski € 85 000 € 90 000 € 90 000
Shari L. Ballard
(1)
€ 0 € 0 € 48 352
François Cornélis
(2)
€ 80 000 € 32 088 € 0
Count de Pret Roose de Calesberg
(3)
€ 85 000 € 36 099 € 0
Jacques de Vaucleroy
(4)
€ 80 000 € 85 989 € 90 000
Hugh Farrington
(5)
€ 85 000 € 90 000 € 93 022
Count Goblet d'Alviella
(6)
€ 85 000 € 45 000 € 0
Jean-Pierre Hansen
(7)
€ 0 € 47 912 € 86 044
Count Jacobs de Hagen
(8)
€ 160 000 € 175 000 € 69 231
Mats Jansson
(9)
€ 0 € 53 901 € 138 352
William McEwan
(10)
€ 0 € 47 912 € 86 044
Robert J. Murray
(11)
€ 89 038 € 80 000 € 31 648
Didier Smits € 80 000 € 80 000 € 80 000
Jack Stahl
(12)
€ 87 981 € 95 000 € 95 000
Baron Vansteenkiste
(13)
€ 82 981 € 90 000 € 90 000
Total Non-Executive Directors € 1 000 000 € 1 048 901 € 997 693
Executive Director
Pierre-Olivier Beckers
(14)
€ 80 000 € 80 000 € 80 000
Total € 1 080 000 € 1 128 901 € 1 077 693
(1) Prorated: Mrs Ballard joined the Board of Directors effective May 24, 2012.
(2) Prorated: Mr Cornélis resigned from the Board of Directors effective May 26, 2011.
(3) Prorated: Mr de Pret Roose de Calesberg resigned from the Board of Directors effective May 26, 2011.
(4) Prorated: Mr de Vaucleroy joined the RNC effective May 26, 2011.
(5) Prorated: Mr Farrington became chairman of the RNC effective May 24, 2012.
(6) Prorated: Mr Goblet d’Alviella resigned from the Board of Directors effective June 30, 2011.
(7) Prorated: Mr Hansen joined the Board of Directors effective May 26, 2011 and became member of the Audit
Committee effective May 24, 2012.
(8) Prorated: Count Jacobs de Hagen resigned from the Board of Directors effective May 24, 2012.
(9) Prorated: Mr Jansson joined the Board of Directors effective May 26, 2011 and became Chairman effective
May 24, 2012.
(10) Prorated: Mr McEwan joined the Board effective May 26, 2011 and became member of the RNC effective
May 26, 2012.
(11) Prorated: Mr Murray resigned from the Audit Committee effective May 27, 2010, from the RNC effective
May 25, 2011 and from the Board of Directors effective May 24, 2012.
(12) Prorated: Mr Stahl became chairman of the Audit Committee effective May 27, 2010.
(13) Prorated: Baron Vansteenkiste became member of the Audit Committee effectieve May 27, 2010.
(14) The amounts solely relate to the remuneration of the executive director and exclude his compensation as CEO
that is separately disclosed below.