Food Lion 2012 Annual Report Download - page 167
Download and view the complete annual report
Please find page 167 of the 2012 Food Lion annual report below. You can navigate through the pages in the report by either clicking on the pages listed below, or by using the keyword search tool below to find specific information within the annual report.-
 1
1 -
2
-
3
-
4
-
5
-
6
-
7
-
8
-
9
-
10
-
11
-
12
-
13
-
14
-
15
-
16
-
17
-
18
-
19
-
20
-
21
-
22
-
23
-
24
-
25
-
26
-
27
-
28
-
29
-
30
-
31
-
32
-
33
-
34
-
35
-
36
-
37
-
38
-
39
-
40
-
41
-
42
-
43
-
44
-
45
-
46
-
47
-
48
-
49
-
50
-
51
-
52
-
53
-
54
-
55
-
56
-
57
-
58
-
59
-
60
-
61
-
62
-
63
-
64
-
65
-
66
-
67
-
68
-
69
-
70
-
71
-
72
-
73
-
74
-
75
-
76
-
77
-
78
-
79
-
80
-
81
-
82
-
83
-
84
-
85
-
86
-
87
-
88
-
89
-
90
-
91
-
92
-
93
-
94
-
95
-
96
-
97
-
98
-
99
-
100
-
101
-
102
-
103
-
104
-
105
-
106
-
107
-
108
-
109
-
110
-
111
-
112
-
113
-
114
-
115
-
116
-
117
-
118
-
119
-
120
-
121
-
122
-
123
-
124
-
125
-
126
-
127
-
128
-
129
-
130
-
131
-
132
-
133
-
134
-
135
-
136
-
137
-
138
-
139
-
140
-
141
-
142
-
143
-
144
-
145
-
146
-
147
-
148
-
149
-
150
-
151
-
152
-
153
-
154
-
155
-
156
-
 157
157 -
 158
158 -
 159
159 -
 160
160 -
 161
161 -
 162
162 -
 163
163 -
 164
164 -
 165
165 -
 166
166 -
 167
167 -
 168
168 -
 169
169 -
 170
170 -
 171
171 -
 172
172 -
 173
173 -
 174
174 -
 175
175 -
 176
176
 |
 |

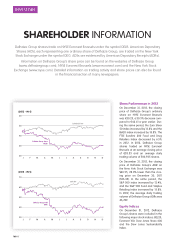
DELHAIZE GROUP FINANCIAL STATEMENTS ’12 // 165
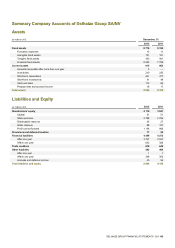
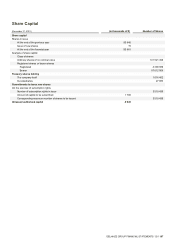
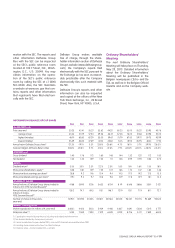
Summary Company Accounts of Delhaize Group SA/NV
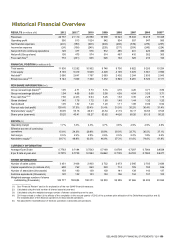
Assets
(in millions of €)
December, 31
2012
2011
Fixed assets
8 779
8 332
Formation expenses
13
11
Intangible fixed assets
131
121
Tangible fixed assets
433
401
Financial fixed assets
8 202
7 799
Current assets
815
863
Amounts receivable after more than one year
5
—
Inventories
210
235
Short-term receivables
441
477
Short-term investments
31
48
Cash and bank
112
86
Prepayments and accrued income
16
17
Total assets
9 594
9 195
Liabilities and Equity
(in millions of €)
2012
2011
Shareholders’ equity
4 116
3 847
Capital
51
51
Share premium
2 798
2 796
Distributable reserves
45
27
Other reserves
88
107
Profit carried forward
1 134
866
Provisions and deferred taxation
17
20
Financial liabilities
4 399
4 273
After one year
3 747
3 947
Within one year
652
326
Trade creditors
670
646
Other liabilities
392
409
After one year
1
1
Within one year
346
352
Accruals and deferred income
45
56
Total liabilities and equity
9 594
9 195