Food Lion 2012 Annual Report Download - page 108
Download and view the complete annual report
Please find page 108 of the 2012 Food Lion annual report below. You can navigate through the pages in the report by either clicking on the pages listed below, or by using the keyword search tool below to find specific information within the annual report.-
 1
1 -
2
-
3
-
4
-
5
-
6
-
7
-
8
-
9
-
10
-
11
-
12
-
13
-
14
-
15
-
16
-
17
-
18
-
19
-
20
-
21
-
22
-
23
-
24
-
25
-
26
-
27
-
28
-
29
-
30
-
31
-
32
-
33
-
34
-
35
-
36
-
37
-
38
-
39
-
40
-
41
-
42
-
43
-
44
-
45
-
46
-
47
-
48
-
49
-
50
-
51
-
52
-
53
-
54
-
55
-
56
-
57
-
58
-
59
-
60
-
61
-
62
-
63
-
64
-
65
-
66
-
67
-
68
-
69
-
70
-
71
-
72
-
73
-
74
-
75
-
76
-
77
-
78
-
79
-
80
-
81
-
82
-
83
-
84
-
85
-
86
-
87
-
88
-
89
-
90
-
91
-
92
-
93
-
94
-
95
-
96
-
97
-
 98
98 -
 99
99 -
 100
100 -
 101
101 -
 102
102 -
 103
103 -
 104
104 -
 105
105 -
 106
106 -
 107
107 -
 108
108 -
 109
109 -
 110
110 -
 111
111 -
 112
112 -
 113
113 -
 114
114 -
 115
115 -
 116
116 -
 117
117 -
 118
118 -
119
-
120
-
121
-
122
-
123
-
124
-
125
-
126
-
127
-
128
-
129
-
130
-
131
-
132
-
133
-
134
-
135
-
136
-
137
-
138
-
139
-
140
-
141
-
142
-
143
-
144
-
145
-
146
-
147
-
148
-
149
-
150
-
151
-
152
-
153
-
154
-
155
-
156
-
157
-
158
-
159
-
160
-
161
-
162
-
163
-
164
-
165
-
166
-
167
-
168
-
169
-
170
-
171
-
172
-
173
-
174
-
175
-
176
 |
 |
106 // DELHAIZE GROUP FINANCIAL STATEMENTS’12
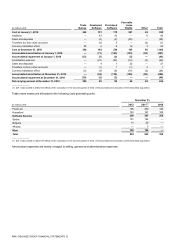
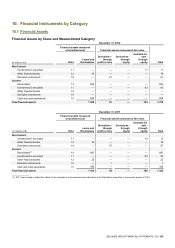
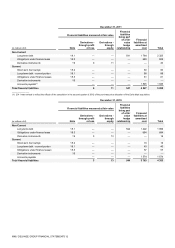
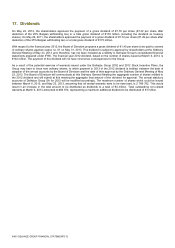
(in millions of €)
December 31, 2010
Financial assets measured
at amortized cost
Financial assets measured at fair value
Note
Loans and
Receivables
Derivatives -
through
profit or loss
Derivatives -
through
equity
Available for
sale -
through
equity
Total
Non-Current
Investments in securities
11
—
—
—
125
125
Other financial assets
12
17
—
—
—
17
Derivative instruments
19
—
61
—
—
61
Current
Receivables
14
637
—
—
—
637
Investments in securities
11
—
—
—
43
43
Other financial assets
12
3
—
—
—
3
Derivative instruments
19
—
5
—
—
5
Cash and cash equivalents
15
758
—
—
—
758
Total financial assets
1 415
66
—
168
1 649
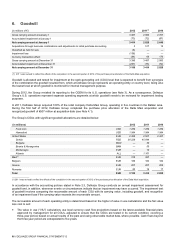
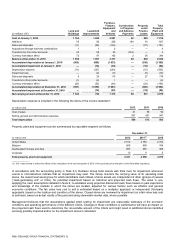
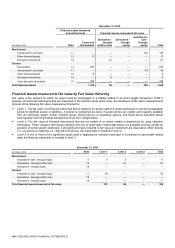
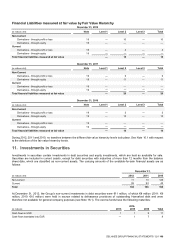
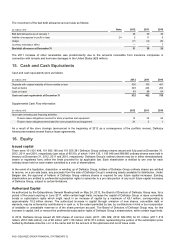
Financial Assets measured at fair value by Fair Value Hierarchy
Fair value is the amount for which an asset could be exchanged or a liability settled in an arm’s length transaction. IFRS 7
requires, for financial instruments that are measured in the balance sheet at fair value, the disclosure of fair value measurements
by level of the following fair value measurement hierarchy:
Level 1: The fair value of a financial instrument that is traded in an active market is measured based on quoted (unadjusted)
prices for identical assets or liabilities. A market is considered as active if quoted prices are readily and regularly available
from an exchange, dealer, broker, industry group, pricing service, or regulatory agency, and those prices represent actual
and regularly occurring market transactions on an arm’s length basis.
Level 2: The fair value of financial instruments that are not traded in an active market is determined by using valuation
techniques. These valuation techniques maximize the use of observable market data where it is available and rely as little as
possible on entity specific estimates. If all significant inputs required to fair value an instrument are observable, either directly
(i.e., as prices) or indirectly (i.e., derived from prices), the instrument is included in level 2.
Level 3: If one or more of the significant inputs used in applying the valuation technique is not based on observable market
data, the financial instrument is included in level 3.
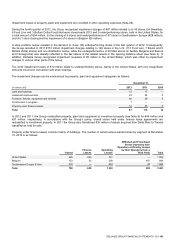
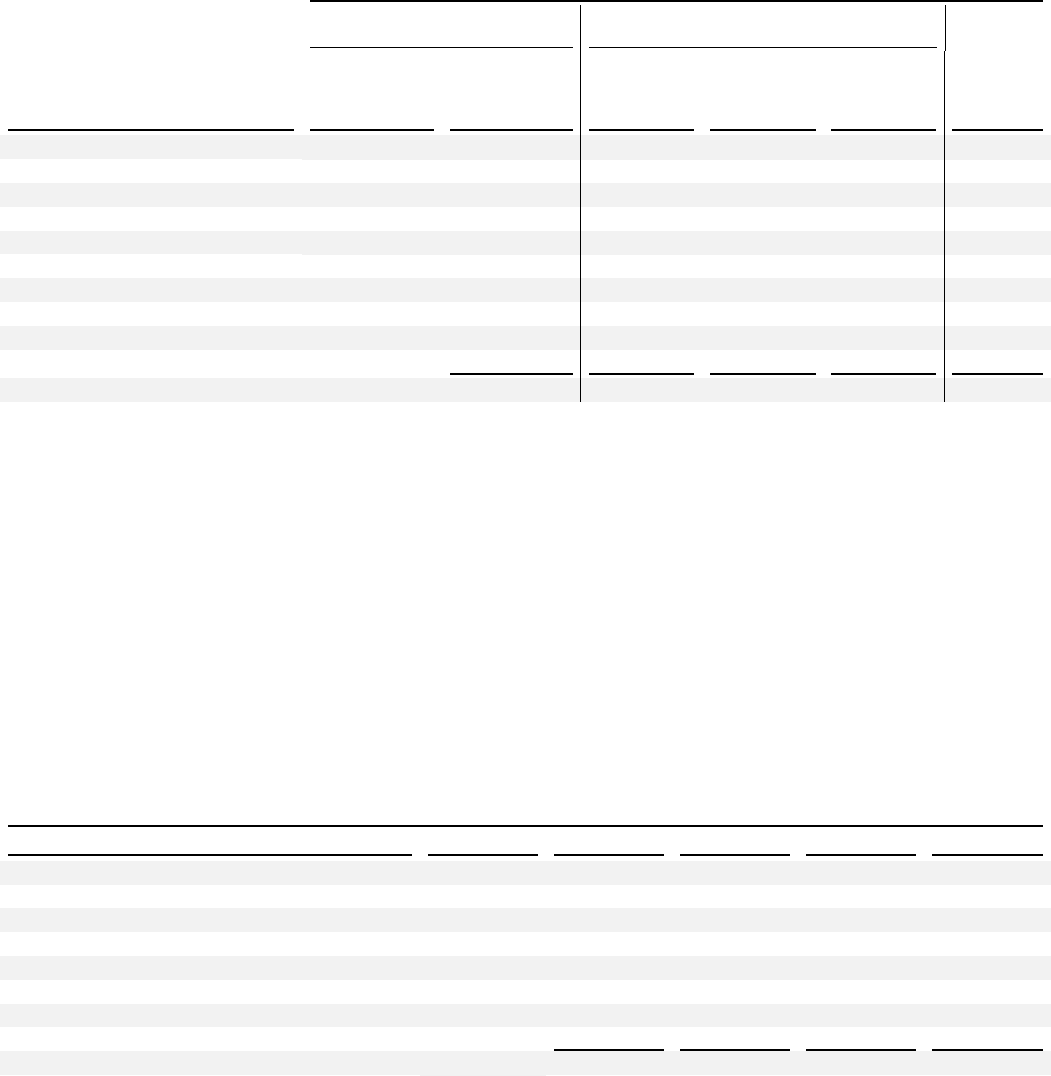
December 31, 2012
(in millions of €)
Note
Level 1
Level 2
Level 3
Total
Non-Current
Available for sale - through equity
11
8
3
—
11
Derivatives - through profit or loss
19
—
61
—
61
Derivatives - through equity
19
—
—
—
—
Current
Available for sale - through equity
11
93
—
—
93
Derivatives - through profit or loss
19
—
—
—
—
Derivatives - through equity
19
—
—
—
—
Total financial assets measured at fair value
101
64
—
165