Food Lion 2012 Annual Report Download - page 28
Download and view the complete annual report
Please find page 28 of the 2012 Food Lion annual report below. You can navigate through the pages in the report by either clicking on the pages listed below, or by using the keyword search tool below to find specific information within the annual report.-
 1
1 -
2
-
3
-
4
-
5
-
6
-
7
-
8
-
9
-
10
-
11
-
12
-
13
-
14
-
15
-
16
-
17
-
 18
18 -
 19
19 -
 20
20 -
 21
21 -
 22
22 -
 23
23 -
 24
24 -
 25
25 -
 26
26 -
 27
27 -
 28
28 -
 29
29 -
 30
30 -
 31
31 -
 32
32 -
 33
33 -
 34
34 -
 35
35 -
 36
36 -
 37
37 -
 38
38 -
39
-
40
-
41
-
42
-
43
-
44
-
45
-
46
-
47
-
48
-
49
-
50
-
51
-
52
-
53
-
54
-
55
-
56
-
57
-
58
-
59
-
60
-
61
-
62
-
63
-
64
-
65
-
66
-
67
-
68
-
69
-
70
-
71
-
72
-
73
-
74
-
75
-
76
-
77
-
78
-
79
-
80
-
81
-
82
-
83
-
84
-
85
-
86
-
87
-
88
-
89
-
90
-
91
-
92
-
93
-
94
-
95
-
96
-
97
-
98
-
99
-
100
-
101
-
102
-
103
-
104
-
105
-
106
-
107
-
108
-
109
-
110
-
111
-
112
-
113
-
114
-
115
-
116
-
117
-
118
-
119
-
120
-
121
-
122
-
123
-
124
-
125
-
126
-
127
-
128
-
129
-
130
-
131
-
132
-
133
-
134
-
135
-
136
-
137
-
138
-
139
-
140
-
141
-
142
-
143
-
144
-
145
-
146
-
147
-
148
-
149
-
150
-
151
-
152
-
153
-
154
-
155
-
156
-
157
-
158
-
159
-
160
-
161
-
162
-
163
-
164
-
165
-
166
-
167
-
168
-
169
-
170
-
171
-
172
-
173
-
174
-
175
-
176
 |
 |

26 //
REVIEW
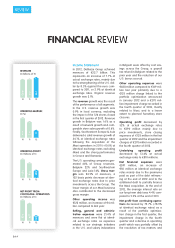
FINANCIAL REVIEW
Income Statement
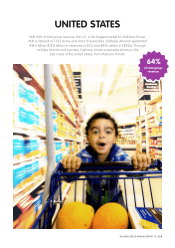
In 2012, Delhaize Group achieved
revenues of €22.7 billion. This
represents an increase of 7.7% at
actual exchange rates, mainly due
to the strengthening of the U.S. dol-
lar by 8.3% against the euro com-
pared to 2011, or 2.9% at identical
exchange rates. Organic revenue
growth was 2.1%.
The revenue growth was the result
of the performance of all segments.
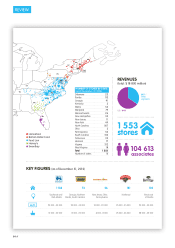
In the U.S. revenue growth was
0.9% in local currency, excluding
the impact of the 126 stores closed
in the fi rst quarter of 2012. Revenue
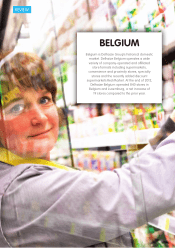
growth in Belgium was 1.6% as a
result of network growth and com-
parable store sales growth of 0.6%.
Finally, Southeastern Europe & Asia
delivered a solid revenue growth of
34.1% at identical exchange rates
following the acquisition of the
Maxi operations in 2011 (+10.0% at
identical exchange rates excluding
Maxi) and the strong performance
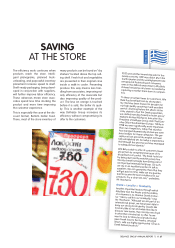
in Greece and Romania.
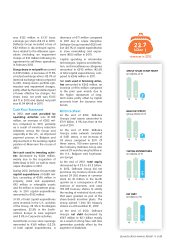
The U.S. operating companies gen-
erated 64% of Group revenues,
Belgium 22% and Southeastern
Europe and Asia 14%. Gross mar-
gin was 24.5% of revenues, a
102 basis points decrease at iden-
tical exchange rates due to price
investments across the Group. The
lower margin of our Maxi business
also contributed to the decreased
gross margin.
Other operating income was
€122 million, an increase of €4 mil-
lion compared to last year.
Selling, general and adminis-
trative expenses were 21.4% of
revenues and were fl at at identi-
cal exchange rates as expenses
related to our strategic initiatives
in the U.S. and salary indexations
in Belgium were offset by cost sav-
ings across the Group, a payroll
tax refund in Belgium related to the
prior year and the reduction of our
U.S. bonus accrual.
Other operating expenses were
€428 million compared to €169 mil-
lion last year primarily due to a
€125 million charge linked to the
portfolio optimization announced
in January 2012 and a €270 mil-
lion impairment charge recorded in
the fourth quarter of 2012, mostly
related to Maxi, and to a lesser
extent to planned Sweetbay store
closures.
Operating profi t decreased by
52% at actual exchange rates
to €390 million mainly due to
price investments, store closing
expenses of €125 million in the fi rst
quarter of 2012 and the impairment
charges of €270 million recorded in
the fourth quarter of 2012.
Underlying operating profi t
decreased by 13.4% at actual
exchange rates to €810 millions.
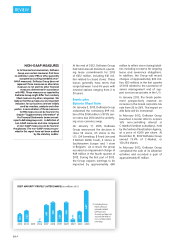
Net fi nancial expenses were
€241 million, an increase of
€50 million at identical exchange
rates mainly due to the premiums
paid as part of the debt refi nanc-
ing at the end of 2012 and to the
additional debt to partially fi nance
the Maxi acquisition. At the end of
2012, the average interest rate on
our long-term debt was 4.4% com-
pared to 5.0% at the end of 2011.
Net profi t from continuing opera-
tions decreased by 73.7% (-78.9%
at identical exchange rates) as a
result of the portfolio optimiza-
tion charge in the fi rst quarter, the
impairment charge in the fourth
quarter and a decline in operating
profi t which was partially offset by
the resolution of tax matters and
REVENUES
(in billions of €)
10
20.8
11
21.1
12
22.7
OPERATING MARGIN
(in %)
10
4.9
11
3.9
12
1.7
OPERATING PROFIT
(in millions of €)
10
1 024
11
813
12
390
NET PROFIT FROM
CONTINUING OPERATIONS
(in millions of €)
10
576
11
477
12
125