Food Lion 2012 Annual Report Download - page 107
Download and view the complete annual report
Please find page 107 of the 2012 Food Lion annual report below. You can navigate through the pages in the report by either clicking on the pages listed below, or by using the keyword search tool below to find specific information within the annual report.-
 1
1 -
2
-
3
-
4
-
5
-
6
-
7
-
8
-
9
-
10
-
11
-
12
-
13
-
14
-
15
-
16
-
17
-
18
-
19
-
20
-
21
-
22
-
23
-
24
-
25
-
26
-
27
-
28
-
29
-
30
-
31
-
32
-
33
-
34
-
35
-
36
-
37
-
38
-
39
-
40
-
41
-
42
-
43
-
44
-
45
-
46
-
47
-
48
-
49
-
50
-
51
-
52
-
53
-
54
-
55
-
56
-
57
-
58
-
59
-
60
-
61
-
62
-
63
-
64
-
65
-
66
-
67
-
68
-
69
-
70
-
71
-
72
-
73
-
74
-
75
-
76
-
77
-
78
-
79
-
80
-
81
-
82
-
83
-
84
-
85
-
86
-
87
-
88
-
89
-
90
-
91
-
92
-
93
-
94
-
95
-
96
-
 97
97 -
 98
98 -
 99
99 -
 100
100 -
 101
101 -
 102
102 -
 103
103 -
 104
104 -
 105
105 -
 106
106 -
 107
107 -
 108
108 -
 109
109 -
 110
110 -
 111
111 -
 112
112 -
 113
113 -
 114
114 -
 115
115 -
 116
116 -
 117
117 -
118
-
119
-
120
-
121
-
122
-
123
-
124
-
125
-
126
-
127
-
128
-
129
-
130
-
131
-
132
-
133
-
134
-
135
-
136
-
137
-
138
-
139
-
140
-
141
-
142
-
143
-
144
-
145
-
146
-
147
-
148
-
149
-
150
-
151
-
152
-
153
-
154
-
155
-
156
-
157
-
158
-
159
-
160
-
161
-
162
-
163
-
164
-
165
-
166
-
167
-
168
-
169
-
170
-
171
-
172
-
173
-
174
-
175
-
176
 |
 |

DELHAIZE GROUP FINANCIAL STATEMENTS ’12 // 105
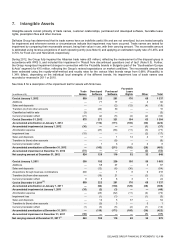
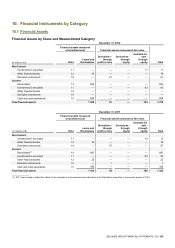
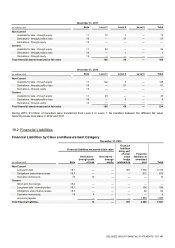
10. Financial Instruments by Category
10.1 Financial Assets
Financial Assets by Class and Measurement Category
(in millions of €)
December 31, 2012
Financial assets measured
at amortized cost
Financial assets measured at fair value
Note
Loans and
Receivables
Derivatives -
through
profit or loss
Derivatives -
through
equity
Available for
sale -
through
equity
Total
Non-Current
Investments in securities
11
—
—
—
11
11
Other financial assets
12
19
—
—
—
19
Derivative instruments
19
—
61
—
—
61
Current
Receivables
14
634
—
—
—
634
Investments in securities
11
—
—
—
93
93
Other financial assets
12
—
—
—
—
—
Derivative instruments
19
—
—
—
—
—
Cash and cash equivalents
15
932
—
—
—
932
Total financial assets
1 585
61
—
104
1 750
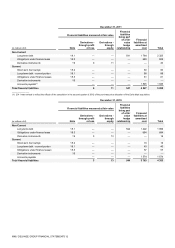
(in millions of €)
December 31, 2011
Financial assets measured
at amortized cost
Financial assets measured at fair value
Note
Loans and
Receivables
Derivatives -
through
profit or loss
Derivatives -
through
equity
Available for
sale -
through
equity
Total
Non-Current
Investments in securities
11
—
—
—
13
13
Other financial assets
12
18
—
—
—
18
Derivative instruments
19
—
57
—
—
57
Current
Receivables(1)
14
697
—
—
—
697
Investments in securities
11
—
—
—
93
93
Other financial assets
12
22
—
—
—
22
Derivative instruments
19
—
1
—
—
1
Cash and cash equivalents
15
432
—
—
—
432
Total financial assets
1 169
58
—
106
1 333
_______________
(1) 2011 was revised to reflect the effects of the completion of the purchase price allocation of the Delta Maxi acquisition in the second quarter of 2012.