Food Lion 2012 Annual Report Download - page 71
Download and view the complete annual report
Please find page 71 of the 2012 Food Lion annual report below. You can navigate through the pages in the report by either clicking on the pages listed below, or by using the keyword search tool below to find specific information within the annual report.-
 1
1 -
2
-
3
-
4
-
5
-
6
-
7
-
8
-
9
-
10
-
11
-
12
-
13
-
14
-
15
-
16
-
17
-
18
-
19
-
20
-
21
-
22
-
23
-
24
-
25
-
26
-
27
-
28
-
29
-
30
-
31
-
32
-
33
-
34
-
35
-
36
-
37
-
38
-
39
-
40
-
41
-
42
-
43
-
44
-
45
-
46
-
47
-
48
-
49
-
50
-
51
-
52
-
53
-
54
-
55
-
56
-
57
-
58
-
59
-
60
-
 61
61 -
 62
62 -
 63
63 -
 64
64 -
 65
65 -
 66
66 -
 67
67 -
 68
68 -
 69
69 -
 70
70 -
 71
71 -
 72
72 -
 73
73 -
 74
74 -
 75
75 -
 76
76 -
 77
77 -
 78
78 -
 79
79 -
 80
80 -
 81
81 -
82
-
83
-
84
-
85
-
86
-
87
-
88
-
89
-
90
-
91
-
92
-
93
-
94
-
95
-
96
-
97
-
98
-
99
-
100
-
101
-
102
-
103
-
104
-
105
-
106
-
107
-
108
-
109
-
110
-
111
-
112
-
113
-
114
-
115
-
116
-
117
-
118
-
119
-
120
-
121
-
122
-
123
-
124
-
125
-
126
-
127
-
128
-
129
-
130
-
131
-
132
-
133
-
134
-
135
-
136
-
137
-
138
-
139
-
140
-
141
-
142
-
143
-
144
-
145
-
146
-
147
-
148
-
149
-
150
-
151
-
152
-
153
-
154
-
155
-
156
-
157
-
158
-
159
-
160
-
161
-
162
-
163
-
164
-
165
-
166
-
167
-
168
-
169
-
170
-
171
-
172
-
173
-
174
-
175
-
176
 |
 |
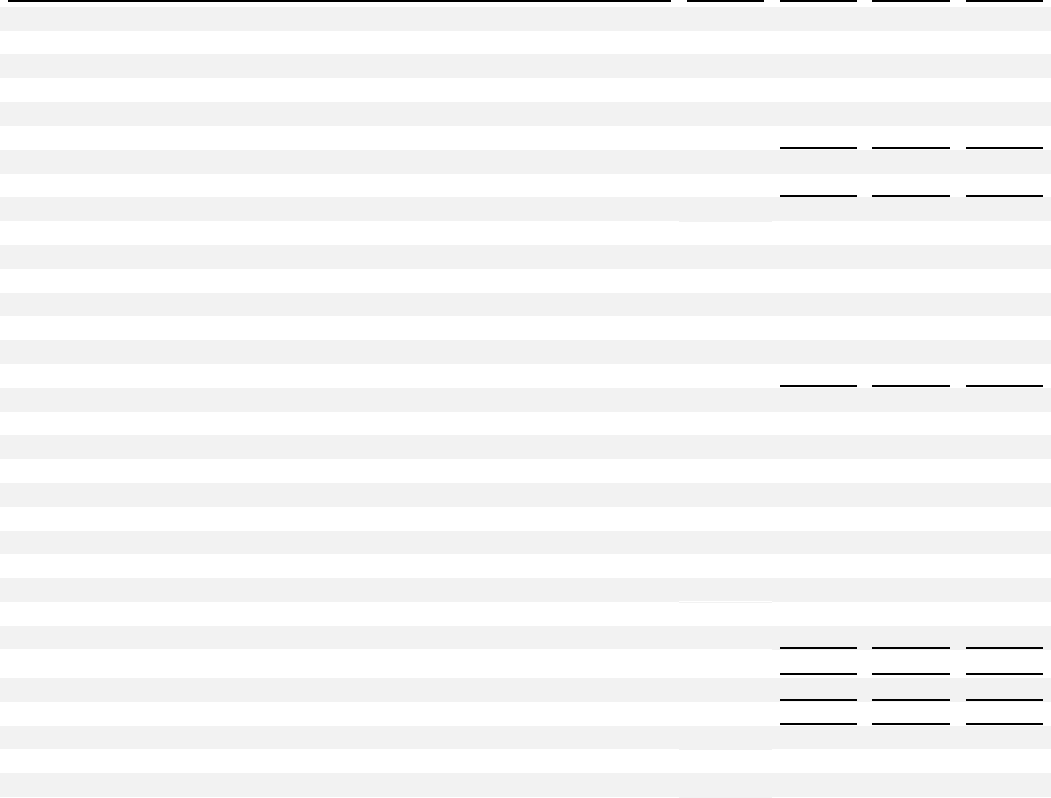
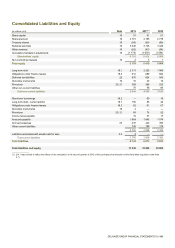
DELHAIZE GROUP FINANCIAL STATEMENTS’12 // 69
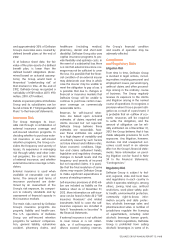
Consolidated Liabilities and Equity
(in millions of €)
Note
2012
2011(1)
2010
Share capital
16
51
51
51
Share premium
16
2 791
2 785
2 778
Treasury shares
16
(59)
(65)
(59)
Retained earnings
16
3 646
3 728
3 426
Other reserves
16
(60)
(47)
(34)
Cumulative translation adjustments
16
(1 178)
(1 038)
(1 094)
Shareholders’ equity
5 191
5 414
5 068
Non-controlling interests
16
2
5
1
Total equity
5 193
5 419
5 069
Long-term debt
18.1
2 313
2 325
1 966
Obligations under finance leases
18.3
612
689
684
Deferred tax liabilities
22
570
624
543
Derivative instruments
19
10
20
16
Provisions
20, 21
369
289
233
Other non-current liabilities
70
98
68
Total non-current liabilities
3 944
4 045
3 510
Short-term borrowings
18.2
—
60
16
Long-term debt - current portion
18.1
156
88
40
Obligations under finance leases
18.3
62
61
57
Derivative instruments
19
4
—
—
Provisions
20, 21
88
76
52
Income taxes payable
19
57
17
Accounts payable
1 884
1 845
1 574
Accrued expenses
23
437
442
393
Other current liabilities
145
199
174
2 795
2 828
2 323
Liabilities associated with assets held for sale
5.2
4
—
—
Total current liabilities
2 799
2 828
2 323
Total liabilities
6 743
6 873
5 833
Total liabilities and equity
11 936
12 292
10 902
_______________
(1) 2011 was revised to reflect the effects of the completion in the second quarter of 2012 of the purchase price allocation of the Delta Maxi acquisition (see Note
4.1).